

|
Fund Information
|
As of: 07/27/2018 | ||||||||||||||||||||||||||||||||||||||||||||||||||||||||||||||||||||||||||||||||||||||||||||||||||||||||||||||||||||||||||||||||||||||||||||||||||||||||||||||||||||||||||||||||||||||||||||||||||||||||||||||||||||||||||||||||||||||||||||||||||||||||||||||||||||||||||||||||||||||||||||||||||||||||||||||||||||||||||||||||||||||||||||||||||||||||||||||||||||||||||||||||||||||||||||||||||||||||||||||||||||||||||||||||||||||||||||||||||||||||||||||||||||||||||||||||||||||||||||||||||||||||||||||
|---|---|---|---|---|---|---|---|---|---|---|---|---|---|---|---|---|---|---|---|---|---|---|---|---|---|---|---|---|---|---|---|---|---|---|---|---|---|---|---|---|---|---|---|---|---|---|---|---|---|---|---|---|---|---|---|---|---|---|---|---|---|---|---|---|---|---|---|---|---|---|---|---|---|---|---|---|---|---|---|---|---|---|---|---|---|---|---|---|---|---|---|---|---|---|---|---|---|---|---|---|---|---|---|---|---|---|---|---|---|---|---|---|---|---|---|---|---|---|---|---|---|---|---|---|---|---|---|---|---|---|---|---|---|---|---|---|---|---|---|---|---|---|---|---|---|---|---|---|---|---|---|---|---|---|---|---|---|---|---|---|---|---|---|---|---|---|---|---|---|---|---|---|---|---|---|---|---|---|---|---|---|---|---|---|---|---|---|---|---|---|---|---|---|---|---|---|---|---|---|---|---|---|---|---|---|---|---|---|---|---|---|---|---|---|---|---|---|---|---|---|---|---|---|---|---|---|---|---|---|---|---|---|---|---|---|---|---|---|---|---|---|---|---|---|---|---|---|---|---|---|---|---|---|---|---|---|---|---|---|---|---|---|---|---|---|---|---|---|---|---|---|---|---|---|---|---|---|---|---|---|---|---|---|---|---|---|---|---|---|---|---|---|---|---|---|---|---|---|---|---|---|---|---|---|---|---|---|---|---|---|---|---|---|---|---|---|---|---|---|---|---|---|---|---|---|---|---|---|---|---|---|---|---|---|---|---|---|---|---|---|---|---|---|---|---|---|---|---|---|---|---|---|---|---|---|---|---|---|---|---|---|---|---|---|---|---|---|---|---|---|---|---|---|---|---|---|---|---|---|---|---|---|---|---|---|---|---|---|---|---|---|---|---|---|---|---|---|---|---|---|---|---|---|---|---|---|---|---|---|---|---|---|---|---|---|---|---|---|---|---|---|---|---|---|---|---|---|---|---|---|---|---|---|---|---|---|---|---|---|---|---|---|---|---|---|---|---|---|---|---|---|---|---|---|---|---|---|---|---|---|---|---|---|---|---|---|---|---|---|---|---|---|---|---|---|---|---|---|---|---|---|---|---|---|---|---|---|---|---|---|---|---|---|---|---|
| NAV | Daily Change | Fact Sheet | Holdings | ||||||||||||||||||||||||||||||||||||||||||||||||||||||||||||||||||||||||||||||||||||||||||||||||||||||||||||||||||||||||||||||||||||||||||||||||||||||||||||||||||||||||||||||||||||||||||||||||||||||||||||||||||||||||||||||||||||||||||||||||||||||||||||||||||||||||||||||||||||||||||||||||||||||||||||||||||||||||||||||||||||||||||||||||||||||||||||||||||||||||||||||||||||||||||||||||||||||||||||||||||||||||||||||||||||||||||||||||||||||||||||||||||||||||||||||||||||||||||||||||||||||||||||
|
|
|
|
||||||||||||||||||||||||||||||||||||||||||||||||||||||||||||||||||||||||||||||||||||||||||||||||||||||||||||||||||||||||||||||||||||||||||||||||||||||||||||||||||||||||||||||||||||||||||||||||||||||||||||||||||||||||||||||||||||||||||||||||||||||||||||||||||||||||||||||||||||||||||||||||||||||||||||||||||||||||||||||||||||||||||||||||||||||||||||||||||||||||||||||||||||||||||||||||||||||||||||||||||||||||||||||||||||||||||||||||||||||||||||||||||||||||||||||||||||||||||||||||||||||||||||
- Manage risk to capital
- Seeks to provide attractive returns and long-term growth of capital
- Typically invests in small and midcap domestic and foreign securities with improving fundamental growth trends
|
Prices
|
As of: 07/27/2018 | ||||
|---|---|---|---|---|---|
| Shares Outstanding | Fund Size ($M) | Closing Bid/Ask (Midpoint) | Daily Volume | Premium/Discount | Expense Ratio | |||||
|---|---|---|---|---|---|---|---|---|---|---|
|
|
|
|
|
1.06% |
|
Performance Month End
|
As of: 06/30/2018 | |||||
|---|---|---|---|---|---|---|
| Name | MTD | QTD | YTD | 1 Year | 3 Year | Since Inception 8/25/2014 | ||||||
|---|---|---|---|---|---|---|---|---|---|---|---|---|
| NAV |
|
|
|
|
|
|
||||||
| Market |
|
|
|
|
|
|
|
Performance Quarter End
|
As of: 06/30/2018 | |||||
|---|---|---|---|---|---|---|
| Name | MTD | QTD | YTD | 1 Year | 3 Year | Since Inception 8/25/2014 | ||||||
|---|---|---|---|---|---|---|---|---|---|---|---|---|
| NAV |
|
|
|
|
|
|
||||||
| Market |
|
|
|
|
|
|
Returns are average annualized total returns, except those for periods of less than one year, which are cumulative. The performance data quoted represents past performance and is not a guarantee of future results. Investment return and principal value of an investment will fluctuate so that an investor's shares, when redeemed, may be worth more or less than their original cost. For most recent month-end performance, please see the monthly performance tab.
|
Fund Characteristics
|
As of: 6/30/2018 |
|---|
| 30-Day SEC Yield | |
|---|---|
|
|
WBIA Top Holdings
|
As of: 07/30/2018 | |
|---|---|---|
| Security Name | Weightings | Shares | ||||||||||||||||||||||||||||||
|---|---|---|---|---|---|---|---|---|---|---|---|---|---|---|---|---|---|---|---|---|---|---|---|---|---|---|---|---|---|---|---|---|
|
|
|
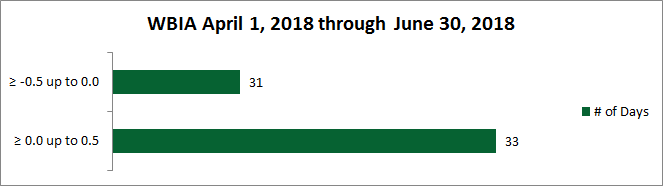
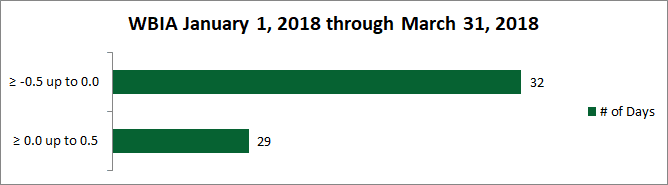
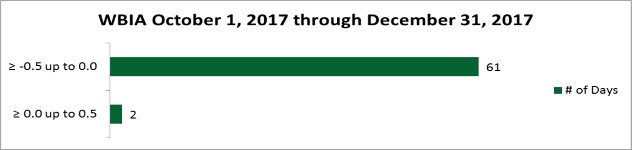
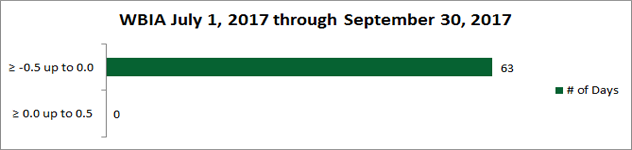
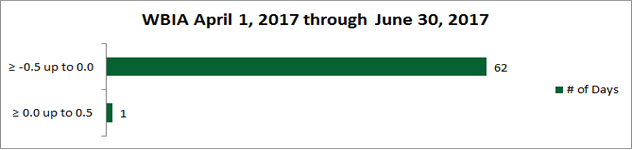
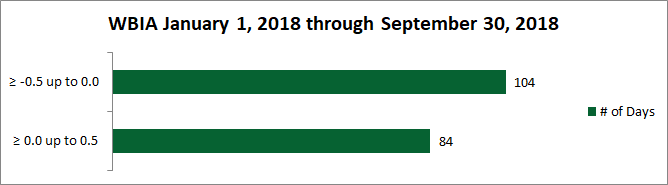
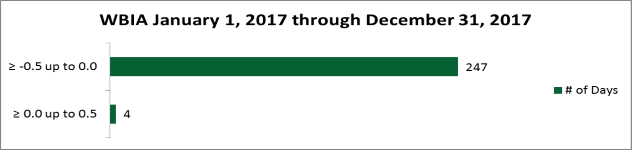
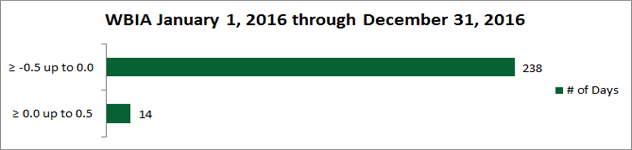
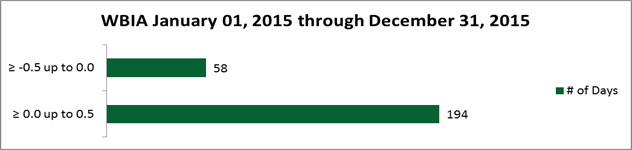
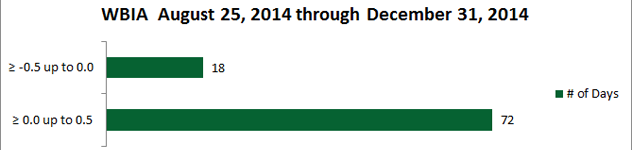
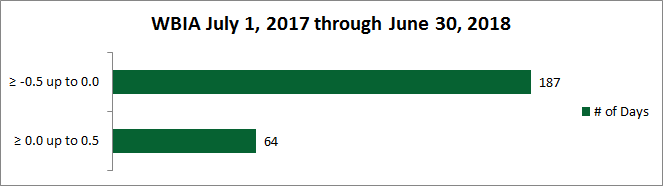
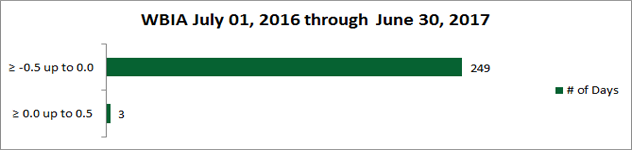
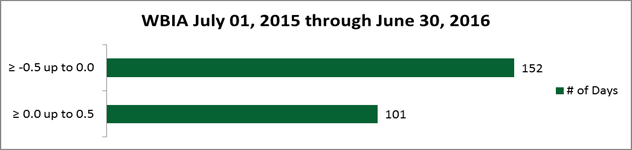
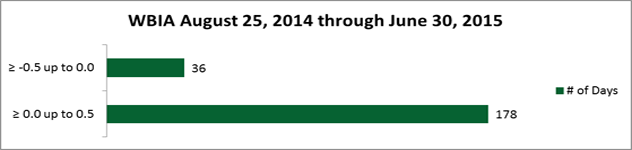
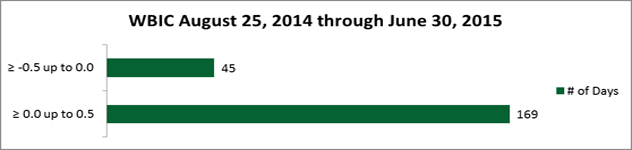
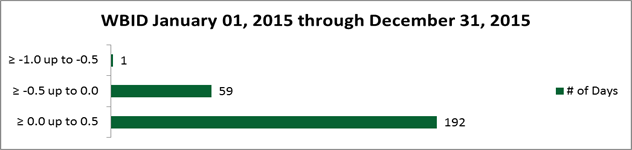
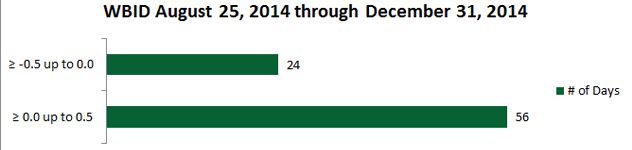
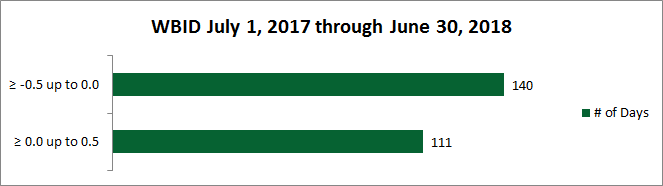
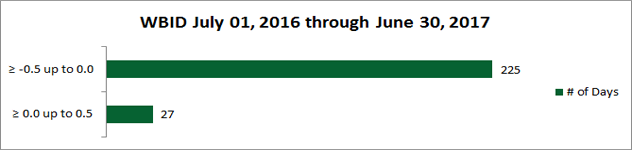
The chart above shows the difference between the daily price for shares of the Fund and the Fund’s NAV (net asset value). The daily price is determined using the midpoint between the highest bid and the lowest offer on the listing exchange, as of 4:00 p.m. EST (when NAV is normally determined for most ETFs). The premium or discount is presented on the vertical axis of the chart and is shown as a percentage of NAV. The number of trading days in the period covered by the chart is indicated on the horizontal axis. The bars in the chart display the number of trading days in which the Fund traded within the premium/discount range shown. The horizontal bar for the range of ≥0.0 up to 0.5 includes the days that the Fund’s daily price matched its NAV (i.e. there was no premium or discount).
|
Fund Information
|
As of: 07/27/2018 | ||||||||||||||||||||||||||||||||||||||||||||||||||||||||||||||||||||||||||||||||||||||||||||||||||||||||||||||||||||||||||||||||||||||||||||||||||||||||||||||||||||||||||||||||||||||||||||||||||||||||||||||||||||||||||||||||||||||||||||||||||||||||||||||||||||||||||||||||||||||||||||||||||||||||||||||||||||||||||||||||||||||||||||||||||||||||||||||||||||||||||||||||||||||||||||||||||||||||||||||||||||||||||||||||||||||||||||||||||||||||||||||||||||||||||||||||||||||||||||||||||||||||||||||||||||||||||||||||||||||||||||||||||||||||||||||||||||||||||||||||||||||||||||||||||
|---|---|---|---|---|---|---|---|---|---|---|---|---|---|---|---|---|---|---|---|---|---|---|---|---|---|---|---|---|---|---|---|---|---|---|---|---|---|---|---|---|---|---|---|---|---|---|---|---|---|---|---|---|---|---|---|---|---|---|---|---|---|---|---|---|---|---|---|---|---|---|---|---|---|---|---|---|---|---|---|---|---|---|---|---|---|---|---|---|---|---|---|---|---|---|---|---|---|---|---|---|---|---|---|---|---|---|---|---|---|---|---|---|---|---|---|---|---|---|---|---|---|---|---|---|---|---|---|---|---|---|---|---|---|---|---|---|---|---|---|---|---|---|---|---|---|---|---|---|---|---|---|---|---|---|---|---|---|---|---|---|---|---|---|---|---|---|---|---|---|---|---|---|---|---|---|---|---|---|---|---|---|---|---|---|---|---|---|---|---|---|---|---|---|---|---|---|---|---|---|---|---|---|---|---|---|---|---|---|---|---|---|---|---|---|---|---|---|---|---|---|---|---|---|---|---|---|---|---|---|---|---|---|---|---|---|---|---|---|---|---|---|---|---|---|---|---|---|---|---|---|---|---|---|---|---|---|---|---|---|---|---|---|---|---|---|---|---|---|---|---|---|---|---|---|---|---|---|---|---|---|---|---|---|---|---|---|---|---|---|---|---|---|---|---|---|---|---|---|---|---|---|---|---|---|---|---|---|---|---|---|---|---|---|---|---|---|---|---|---|---|---|---|---|---|---|---|---|---|---|---|---|---|---|---|---|---|---|---|---|---|---|---|---|---|---|---|---|---|---|---|---|---|---|---|---|---|---|---|---|---|---|---|---|---|---|---|---|---|---|---|---|---|---|---|---|---|---|---|---|---|---|---|---|---|---|---|---|---|---|---|---|---|---|---|---|---|---|---|---|---|---|---|---|---|---|---|---|---|---|---|---|---|---|---|---|---|---|---|---|---|---|---|---|---|---|---|---|---|---|---|---|---|---|---|---|---|---|---|---|---|---|---|---|---|---|---|---|---|---|---|---|---|---|---|---|---|---|---|---|---|---|---|---|---|---|---|---|---|---|---|---|---|---|---|---|---|---|---|---|---|---|---|---|---|---|---|---|---|---|---|---|---|---|---|---|---|---|---|---|---|---|---|---|---|---|---|---|---|---|---|---|---|---|---|---|---|---|---|---|---|---|---|---|---|---|---|---|---|---|---|---|---|---|---|---|---|---|---|---|---|---|---|---|---|---|---|---|---|---|---|---|---|---|---|---|---|---|---|---|---|---|---|---|---|---|---|---|---|---|---|---|---|---|---|---|---|---|---|---|
| NAV | Daily Change | Fact Sheet | Holdings | ||||||||||||||||||||||||||||||||||||||||||||||||||||||||||||||||||||||||||||||||||||||||||||||||||||||||||||||||||||||||||||||||||||||||||||||||||||||||||||||||||||||||||||||||||||||||||||||||||||||||||||||||||||||||||||||||||||||||||||||||||||||||||||||||||||||||||||||||||||||||||||||||||||||||||||||||||||||||||||||||||||||||||||||||||||||||||||||||||||||||||||||||||||||||||||||||||||||||||||||||||||||||||||||||||||||||||||||||||||||||||||||||||||||||||||||||||||||||||||||||||||||||||||||||||||||||||||||||||||||||||||||||||||||||||||||||||||||||||||||||||||||||||||||||
|
|
|
|
||||||||||||||||||||||||||||||||||||||||||||||||||||||||||||||||||||||||||||||||||||||||||||||||||||||||||||||||||||||||||||||||||||||||||||||||||||||||||||||||||||||||||||||||||||||||||||||||||||||||||||||||||||||||||||||||||||||||||||||||||||||||||||||||||||||||||||||||||||||||||||||||||||||||||||||||||||||||||||||||||||||||||||||||||||||||||||||||||||||||||||||||||||||||||||||||||||||||||||||||||||||||||||||||||||||||||||||||||||||||||||||||||||||||||||||||||||||||||||||||||||||||||||||||||||||||||||||||||||||||||||||||||||||||||||||||||||||||||||||||||||||||||||||||
- Manage risk to capital
- Seeks to provide attractive returns and long-term growth of capital
- Typically invests in small and midcap domestic and foreign securities with consistent fundamentals and strong value characteristics
|
Prices
|
As of: 07/27/2018 | ||||
|---|---|---|---|---|---|
| Shares Outstanding | Fund Size ($M) | Closing Bid/Ask (Midpoint) | Daily Volume | Premium/Discount | Expense Ratio | |||||
|---|---|---|---|---|---|---|---|---|---|---|
|
|
|
|
|
1.05% |
|
Performance Month End
|
As of: 06/30/2018 | |||||
|---|---|---|---|---|---|---|
| Name | MTD | QTD | YTD | 1 Year | 3 Year | Since Inception 8/25/2014 | ||||||
|---|---|---|---|---|---|---|---|---|---|---|---|---|
| NAV |
|
|
|
|
|
|
||||||
| Market |
|
|
|
|
|
|
|
Performance Quarter End
|
As of: 06/30/2018 | |||||
|---|---|---|---|---|---|---|
| Name | MTD | QTD | YTD | 1 Year | 3 Year | Since Inception 8/25/2014 | ||||||
|---|---|---|---|---|---|---|---|---|---|---|---|---|
| NAV |
|
|
|
|
|
|
||||||
| Market |
|
|
|
|
|
|
Returns are average annualized total returns, except those for periods of less than one year, which are cumulative. The performance data quoted represents past performance and is not a guarantee of future results. Investment return and principal value of an investment will fluctuate so that an investor's shares, when redeemed, may be worth more or less than their original cost. For most recent month-end performance, please see the monthly performance tab.
|
Fund Characteristics
|
As of: 6/30/2018 |
|---|
| 30-Day SEC Yield | |
|---|---|
|
|
WBIB Top Holdings
|
As of: 07/30/2018 | |
|---|---|---|
| Security Name | Weightings | Shares | ||||||||||||||||||||||||||||||
|---|---|---|---|---|---|---|---|---|---|---|---|---|---|---|---|---|---|---|---|---|---|---|---|---|---|---|---|---|---|---|---|---|
|
|
|
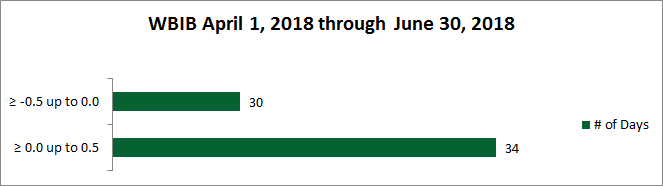
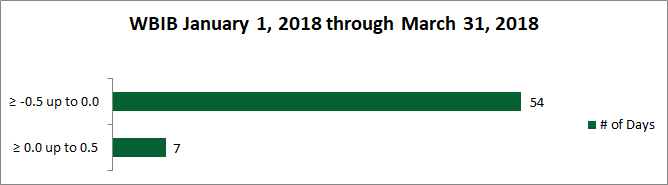

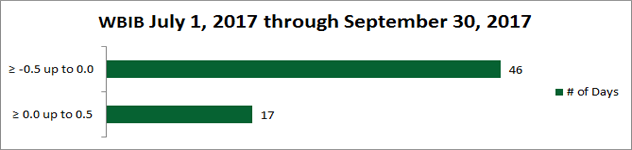
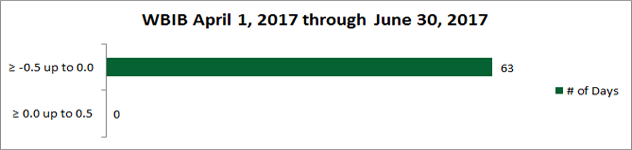
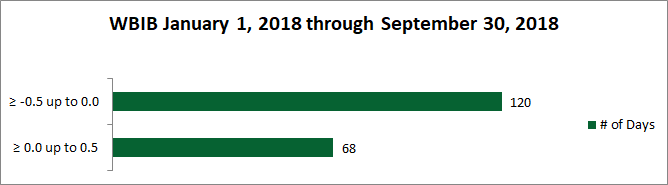
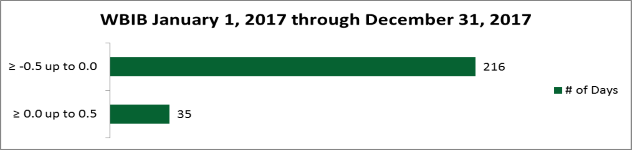

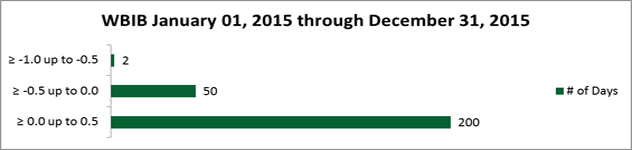
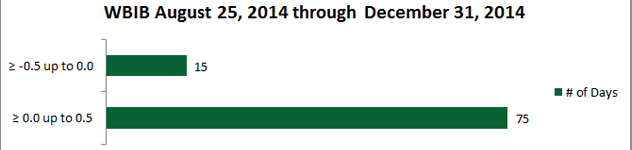
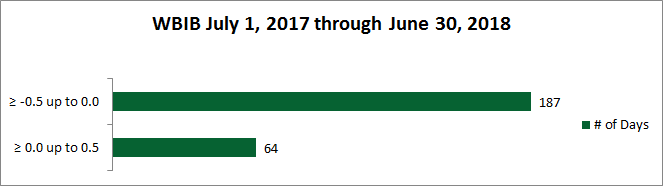
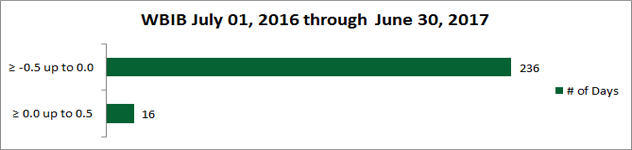
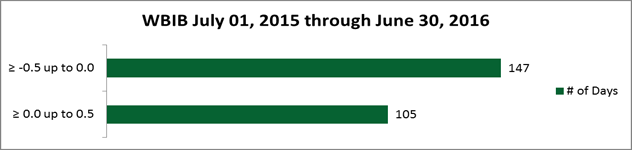
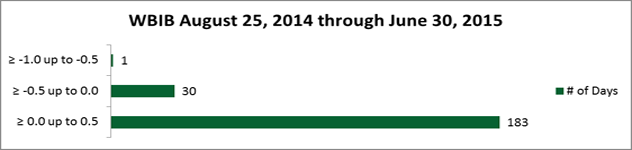
The chart above shows the difference between the daily price for shares of the Fund and the Fund’s NAV (net asset value). The daily price is determined using the midpoint between the highest bid and the lowest offer on the listing exchange, as of 4:00 p.m. EST (when NAV is normally determined for most ETFs). The premium or discount is presented on the vertical axis of the chart and is shown as a percentage of NAV. The number of trading days in the period covered by the chart is indicated on the horizontal axis. The bars in the chart display the number of trading days in which the Fund traded within the premium/discount range shown. The horizontal bar for the range of ≥0.0 up to 0.5 includes the days that the Fund’s daily price matched its NAV (i.e. there was no premium or discount).
|
Fund Information
|
As of: 07/27/2018 | ||||||||||||||||||||||||||||||||||||||||||||||||||||||||||||||||||||||||||||||||||||||||||||||||||||||||||||||||||||||||||||||||||||||||||||||||||||||||||||||||||||||||||||||||||||||||||||||||||||||||||||||||||||||||||||||||||||||||||||||||||||||||||||||||||||||||||||||||||||||||||||||||||||||||||||||||||||||||||||||||||||||||||||||||||||||||||||||||||||||||||||||||||||||||||||||||||||||||||||||||||||||||||||||||||||||||||||||||||||||||||||||||||||||||||||||||||||||||||||||||||||||||||||||||||||||||||||||||||||||||||||||||||||||||
|---|---|---|---|---|---|---|---|---|---|---|---|---|---|---|---|---|---|---|---|---|---|---|---|---|---|---|---|---|---|---|---|---|---|---|---|---|---|---|---|---|---|---|---|---|---|---|---|---|---|---|---|---|---|---|---|---|---|---|---|---|---|---|---|---|---|---|---|---|---|---|---|---|---|---|---|---|---|---|---|---|---|---|---|---|---|---|---|---|---|---|---|---|---|---|---|---|---|---|---|---|---|---|---|---|---|---|---|---|---|---|---|---|---|---|---|---|---|---|---|---|---|---|---|---|---|---|---|---|---|---|---|---|---|---|---|---|---|---|---|---|---|---|---|---|---|---|---|---|---|---|---|---|---|---|---|---|---|---|---|---|---|---|---|---|---|---|---|---|---|---|---|---|---|---|---|---|---|---|---|---|---|---|---|---|---|---|---|---|---|---|---|---|---|---|---|---|---|---|---|---|---|---|---|---|---|---|---|---|---|---|---|---|---|---|---|---|---|---|---|---|---|---|---|---|---|---|---|---|---|---|---|---|---|---|---|---|---|---|---|---|---|---|---|---|---|---|---|---|---|---|---|---|---|---|---|---|---|---|---|---|---|---|---|---|---|---|---|---|---|---|---|---|---|---|---|---|---|---|---|---|---|---|---|---|---|---|---|---|---|---|---|---|---|---|---|---|---|---|---|---|---|---|---|---|---|---|---|---|---|---|---|---|---|---|---|---|---|---|---|---|---|---|---|---|---|---|---|---|---|---|---|---|---|---|---|---|---|---|---|---|---|---|---|---|---|---|---|---|---|---|---|---|---|---|---|---|---|---|---|---|---|---|---|---|---|---|---|---|---|---|---|---|---|---|---|---|---|---|---|---|---|---|---|---|---|---|---|---|---|---|---|---|---|---|---|---|---|---|---|---|---|---|---|---|---|---|---|---|---|---|---|---|---|---|---|---|---|---|---|---|---|---|---|---|---|---|---|---|---|---|---|---|---|---|---|---|---|---|---|---|---|---|---|---|---|---|---|---|---|---|---|---|---|---|---|---|---|---|---|---|---|---|---|---|---|---|---|---|---|---|---|---|---|---|---|---|---|---|---|---|---|---|---|---|---|---|---|---|---|---|---|---|---|---|---|---|---|---|---|---|---|---|---|---|---|---|---|---|---|---|---|---|---|---|---|---|---|---|---|---|---|---|---|---|---|---|---|---|---|---|---|---|---|---|---|---|---|
| NAV | Daily Change | Fact Sheet | Holdings | ||||||||||||||||||||||||||||||||||||||||||||||||||||||||||||||||||||||||||||||||||||||||||||||||||||||||||||||||||||||||||||||||||||||||||||||||||||||||||||||||||||||||||||||||||||||||||||||||||||||||||||||||||||||||||||||||||||||||||||||||||||||||||||||||||||||||||||||||||||||||||||||||||||||||||||||||||||||||||||||||||||||||||||||||||||||||||||||||||||||||||||||||||||||||||||||||||||||||||||||||||||||||||||||||||||||||||||||||||||||||||||||||||||||||||||||||||||||||||||||||||||||||||||||||||||||||||||||||||||||||||||||||||||||
|
|
|
|
||||||||||||||||||||||||||||||||||||||||||||||||||||||||||||||||||||||||||||||||||||||||||||||||||||||||||||||||||||||||||||||||||||||||||||||||||||||||||||||||||||||||||||||||||||||||||||||||||||||||||||||||||||||||||||||||||||||||||||||||||||||||||||||||||||||||||||||||||||||||||||||||||||||||||||||||||||||||||||||||||||||||||||||||||||||||||||||||||||||||||||||||||||||||||||||||||||||||||||||||||||||||||||||||||||||||||||||||||||||||||||||||||||||||||||||||||||||||||||||||||||||||||||||||||||||||||||||||||||||||||||||||||||||
- Manage risk to capital
- Generate an attractive current yield that helps to promote compounding
- Seeks to provide attractive returns and long-term growth of capital
- Typically invests in small and midcap domestic and foreign securities that present themselves as undervalued opportunities with attractive dividend yields
|
Prices
|
As of: 07/27/2018 | ||||
|---|---|---|---|---|---|
| Shares Outstanding | Fund Size ($M) | Closing Bid/Ask (Midpoint) | Daily Volume | Premium/Discount | Expense Ratio | |||||
|---|---|---|---|---|---|---|---|---|---|---|
|
|
|
|
|
1.05% |
|
Performance Month End
|
As of: 06/30/2018 | |||||
|---|---|---|---|---|---|---|
| Name | MTD | QTD | YTD | 1 Year | 3 Year | Since Inception 8/25/2014 | ||||||
|---|---|---|---|---|---|---|---|---|---|---|---|---|
| NAV |
|
|
|
|
|
|
||||||
| Market |
|
|
|
|
|
|
|
Performance Quarter End
|
As of: 06/30/2018 | |||||
|---|---|---|---|---|---|---|
| Name | MTD | QTD | YTD | 1 Year | 3 Year | Since Inception 8/25/2014 | ||||||
|---|---|---|---|---|---|---|---|---|---|---|---|---|
| NAV |
|
|
|
|
|
|
||||||
| Market |
|
|
|
|
|
|
Returns are average annualized total returns, except those for periods of less than one year, which are cumulative. The performance data quoted represents past performance and is not a guarantee of future results. Investment return and principal value of an investment will fluctuate so that an investor's shares, when redeemed, may be worth more or less than their original cost. For most recent month-end performance, please see the monthly performance tab.
|
Fund Characteristics
|
As of: 6/30/2018 |
|---|
| 30-Day SEC Yield | |
|---|---|
|
|
WBIC Top Holdings
|
As of: 07/30/2018 | |
|---|---|---|
| Security Name | Weightings | Shares | ||||||||||||||||||||||||||||||
|---|---|---|---|---|---|---|---|---|---|---|---|---|---|---|---|---|---|---|---|---|---|---|---|---|---|---|---|---|---|---|---|---|
|
|
|
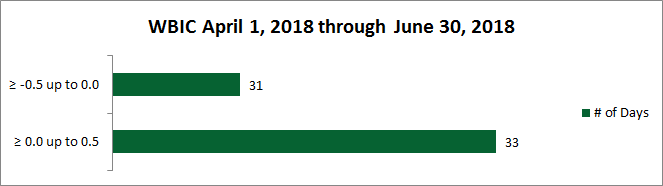
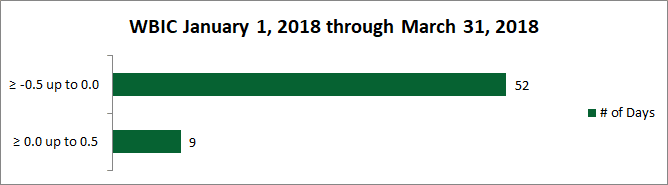
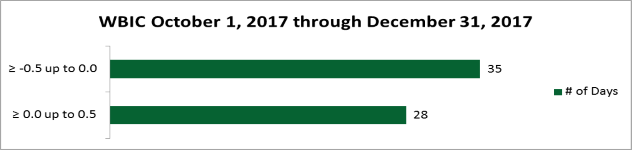
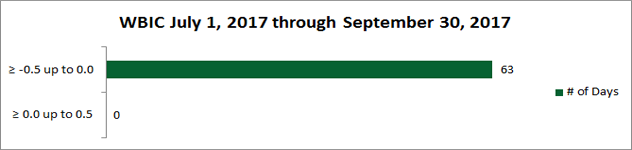
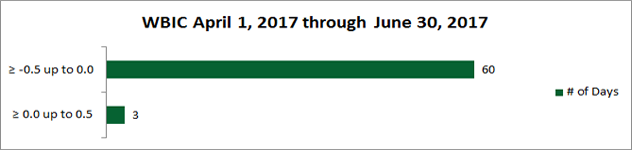
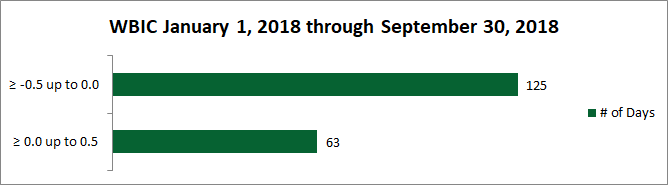
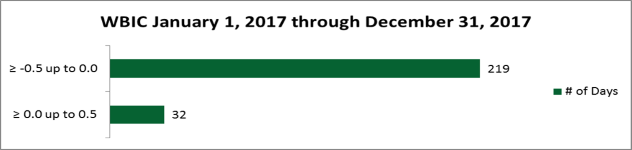

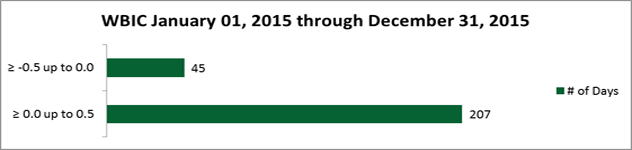
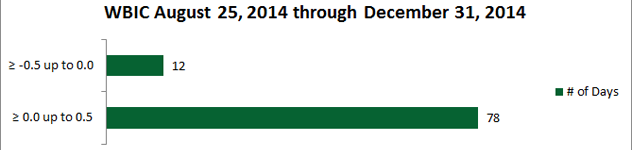
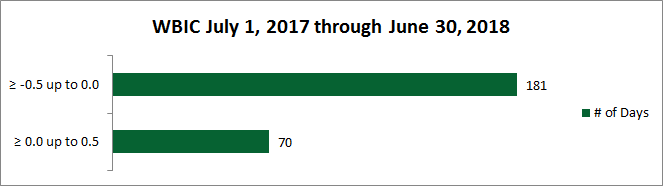
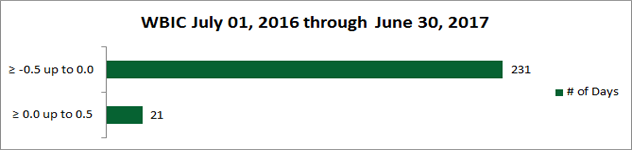

The chart above shows the difference between the daily price for shares of the Fund and the Fund’s NAV (net asset value). The daily price is determined using the midpoint between the highest bid and the lowest offer on the listing exchange, as of 4:00 p.m. EST (when NAV is normally determined for most ETFs). The premium or discount is presented on the vertical axis of the chart and is shown as a percentage of NAV. The number of trading days in the period covered by the chart is indicated on the horizontal axis. The bars in the chart display the number of trading days in which the Fund traded within the premium/discount range shown. The horizontal bar for the range of ≥0.0 up to 0.5 includes the days that the Fund’s daily price matched its NAV (i.e. there was no premium or discount).
|
Fund Information
|
As of: 07/27/2018 | ||||||||||||||||||||||||||||||||||||||||||||||||||||||||||||||||||||||||||||||||||||||||||||||||||||||||||||||||||||||||||||||||||||||||||||||||||||||||||||||||||||||||||||||||||||||||||||||||||||||||||||||||||||||||||||||||||||||||||||||||||||||||||||||||||||||||||||||||||||||||||||||||||||||||||||||||||||||||||||||||||||||||||||||||||||||||||||||||||||||||||||||||||||||||||||||||||||||||||||||||||||||||||||||||||||||||||||||||||||||||||||||||||||
|---|---|---|---|---|---|---|---|---|---|---|---|---|---|---|---|---|---|---|---|---|---|---|---|---|---|---|---|---|---|---|---|---|---|---|---|---|---|---|---|---|---|---|---|---|---|---|---|---|---|---|---|---|---|---|---|---|---|---|---|---|---|---|---|---|---|---|---|---|---|---|---|---|---|---|---|---|---|---|---|---|---|---|---|---|---|---|---|---|---|---|---|---|---|---|---|---|---|---|---|---|---|---|---|---|---|---|---|---|---|---|---|---|---|---|---|---|---|---|---|---|---|---|---|---|---|---|---|---|---|---|---|---|---|---|---|---|---|---|---|---|---|---|---|---|---|---|---|---|---|---|---|---|---|---|---|---|---|---|---|---|---|---|---|---|---|---|---|---|---|---|---|---|---|---|---|---|---|---|---|---|---|---|---|---|---|---|---|---|---|---|---|---|---|---|---|---|---|---|---|---|---|---|---|---|---|---|---|---|---|---|---|---|---|---|---|---|---|---|---|---|---|---|---|---|---|---|---|---|---|---|---|---|---|---|---|---|---|---|---|---|---|---|---|---|---|---|---|---|---|---|---|---|---|---|---|---|---|---|---|---|---|---|---|---|---|---|---|---|---|---|---|---|---|---|---|---|---|---|---|---|---|---|---|---|---|---|---|---|---|---|---|---|---|---|---|---|---|---|---|---|---|---|---|---|---|---|---|---|---|---|---|---|---|---|---|---|---|---|---|---|---|---|---|---|---|---|---|---|---|---|---|---|---|---|---|---|---|---|---|---|---|---|---|---|---|---|---|---|---|---|---|---|---|---|---|---|---|---|---|---|---|---|---|---|---|---|---|---|---|---|---|---|---|---|---|---|---|---|---|---|---|---|---|---|---|---|---|---|---|---|---|---|---|---|---|---|---|---|---|---|---|---|---|---|---|---|---|---|---|---|---|---|---|---|---|---|---|---|---|---|---|---|---|---|---|---|---|---|---|---|---|---|---|---|---|---|---|---|---|---|---|---|---|---|---|---|---|---|---|---|---|---|---|
| NAV | Daily Change | Fact Sheet | Holdings | ||||||||||||||||||||||||||||||||||||||||||||||||||||||||||||||||||||||||||||||||||||||||||||||||||||||||||||||||||||||||||||||||||||||||||||||||||||||||||||||||||||||||||||||||||||||||||||||||||||||||||||||||||||||||||||||||||||||||||||||||||||||||||||||||||||||||||||||||||||||||||||||||||||||||||||||||||||||||||||||||||||||||||||||||||||||||||||||||||||||||||||||||||||||||||||||||||||||||||||||||||||||||||||||||||||||||||||||||||||||||||||||||||
|
|
|
|
||||||||||||||||||||||||||||||||||||||||||||||||||||||||||||||||||||||||||||||||||||||||||||||||||||||||||||||||||||||||||||||||||||||||||||||||||||||||||||||||||||||||||||||||||||||||||||||||||||||||||||||||||||||||||||||||||||||||||||||||||||||||||||||||||||||||||||||||||||||||||||||||||||||||||||||||||||||||||||||||||||||||||||||||||||||||||||||||||||||||||||||||||||||||||||||||||||||||||||||||||||||||||||||||||||||||||||||||||||||||||||||||||
- Manage risk to capital
- Seeks to provide attractive returns and long-term growth of capital
- Typically invests in small and midcap domestic and foreign securities with attractive value characteristics and prospects for financial stability
|
Prices
|
As of: 07/27/2018 | ||||
|---|---|---|---|---|---|
| Shares Outstanding | Fund Size ($M) | Closing Bid/Ask (Midpoint) | Daily Volume | Premium/Discount | Expense Ratio | |||||
|---|---|---|---|---|---|---|---|---|---|---|
|
|
|
|
|
1.06% |
|
Performance Month End
|
As of: 06/30/2018 | |||||
|---|---|---|---|---|---|---|
| Name | MTD | QTD | YTD | 1 Year | 3 Year | Since Inception 8/25/2014 | ||||||
|---|---|---|---|---|---|---|---|---|---|---|---|---|
| NAV |
|
|
|
|
|
|
||||||
| Market |
|
|
|
|
|
|
|
Performance Quarter End
|
As of: 06/30/2018 | |||||
|---|---|---|---|---|---|---|
| Name | MTD | QTD | YTD | 1 Year | 3 Year | Since Inception 8/25/2014 | ||||||
|---|---|---|---|---|---|---|---|---|---|---|---|---|
| NAV |
|
|
|
|
|
|
||||||
| Market |
|
|
|
|
|
|
Returns are average annualized total returns, except those for periods of less than one year, which are cumulative. The performance data quoted represents past performance and is not a guarantee of future results. Investment return and principal value of an investment will fluctuate so that an investor's shares, when redeemed, may be worth more or less than their original cost. For most recent month-end performance, please see the monthly performance tab.
|
Fund Characteristics
|
As of: 6/30/2018 |
|---|
| 30-Day SEC Yield | |
|---|---|
|
|
WBID Top Holdings
|
As of: 07/30/2018 | |
|---|---|---|
| Security Name | Weightings | Shares | ||||||||||||||||||||||||||||||
|---|---|---|---|---|---|---|---|---|---|---|---|---|---|---|---|---|---|---|---|---|---|---|---|---|---|---|---|---|---|---|---|---|
|
|
|

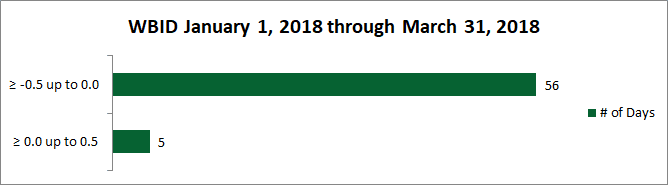
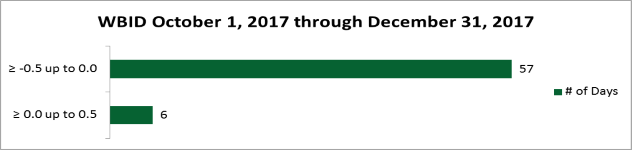
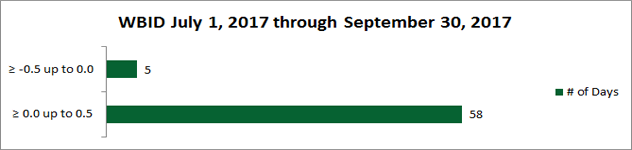
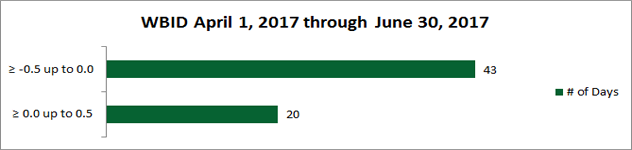

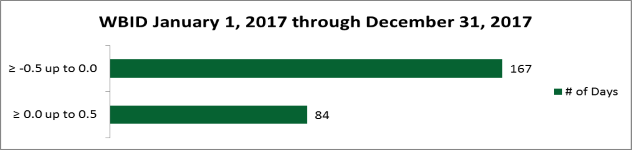
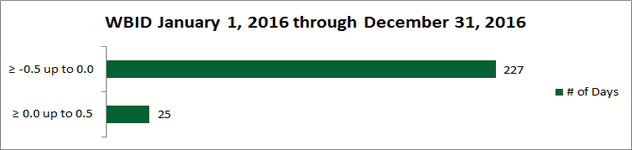

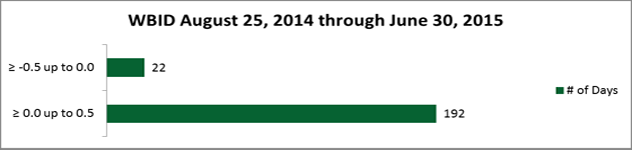
The chart above shows the difference between the daily price for shares of the Fund and the Fund’s NAV (net asset value). The daily price is determined using the midpoint between the highest bid and the lowest offer on the listing exchange, as of 4:00 p.m. EST (when NAV is normally determined for most ETFs). The premium or discount is presented on the vertical axis of the chart and is shown as a percentage of NAV. The number of trading days in the period covered by the chart is indicated on the horizontal axis. The bars in the chart display the number of trading days in which the Fund traded within the premium/discount range shown. The horizontal bar for the range of ≥0.0 up to 0.5 includes the days that the Fund’s daily price matched its NAV (i.e. there was no premium or discount).
|
Fund Information
|
As of: 07/27/2018 | ||||||||||||||||||||||||||||||||||||||||||||||||||||||||||||||||||||||||||||||||||||||||||||||||||||||||||||||||||||||||||||||||||||||||||||||||||||||||||||||||||||||||||||||||||||||||||||||||||||||||||||||||||||||||||||||||||||||||||||||||||||||||||||||||||||||||||||||||||||||||||||||||||||||||||||||||||||||||||||||||||||||||||||||||||||||||||||||||||||||||||||||||||||||||||||||||||||||||||||||||||||||||||||||||||||||||
|---|---|---|---|---|---|---|---|---|---|---|---|---|---|---|---|---|---|---|---|---|---|---|---|---|---|---|---|---|---|---|---|---|---|---|---|---|---|---|---|---|---|---|---|---|---|---|---|---|---|---|---|---|---|---|---|---|---|---|---|---|---|---|---|---|---|---|---|---|---|---|---|---|---|---|---|---|---|---|---|---|---|---|---|---|---|---|---|---|---|---|---|---|---|---|---|---|---|---|---|---|---|---|---|---|---|---|---|---|---|---|---|---|---|---|---|---|---|---|---|---|---|---|---|---|---|---|---|---|---|---|---|---|---|---|---|---|---|---|---|---|---|---|---|---|---|---|---|---|---|---|---|---|---|---|---|---|---|---|---|---|---|---|---|---|---|---|---|---|---|---|---|---|---|---|---|---|---|---|---|---|---|---|---|---|---|---|---|---|---|---|---|---|---|---|---|---|---|---|---|---|---|---|---|---|---|---|---|---|---|---|---|---|---|---|---|---|---|---|---|---|---|---|---|---|---|---|---|---|---|---|---|---|---|---|---|---|---|---|---|---|---|---|---|---|---|---|---|---|---|---|---|---|---|---|---|---|---|---|---|---|---|---|---|---|---|---|---|---|---|---|---|---|---|---|---|---|---|---|---|---|---|---|---|---|---|---|---|---|---|---|---|---|---|---|---|---|---|---|---|---|---|---|---|---|---|---|---|---|---|---|---|---|---|---|---|---|---|---|---|---|---|---|---|---|---|---|---|---|---|---|---|---|---|---|---|---|---|---|---|---|---|---|---|---|---|---|---|---|---|---|---|---|---|---|---|---|---|---|---|---|---|---|---|---|---|---|---|---|---|---|---|---|---|---|---|---|---|---|---|---|---|---|---|---|---|---|---|---|---|---|---|---|---|---|---|---|---|---|---|---|---|---|---|---|---|---|---|---|---|---|---|---|---|---|---|---|---|---|---|---|---|---|---|---|---|
| NAV | Daily Change | Fact Sheet | Holdings | ||||||||||||||||||||||||||||||||||||||||||||||||||||||||||||||||||||||||||||||||||||||||||||||||||||||||||||||||||||||||||||||||||||||||||||||||||||||||||||||||||||||||||||||||||||||||||||||||||||||||||||||||||||||||||||||||||||||||||||||||||||||||||||||||||||||||||||||||||||||||||||||||||||||||||||||||||||||||||||||||||||||||||||||||||||||||||||||||||||||||||||||||||||||||||||||||||||||||||||||||||||||||||||||||||||||
|
|
|
|
||||||||||||||||||||||||||||||||||||||||||||||||||||||||||||||||||||||||||||||||||||||||||||||||||||||||||||||||||||||||||||||||||||||||||||||||||||||||||||||||||||||||||||||||||||||||||||||||||||||||||||||||||||||||||||||||||||||||||||||||||||||||||||||||||||||||||||||||||||||||||||||||||||||||||||||||||||||||||||||||||||||||||||||||||||||||||||||||||||||||||||||||||||||||||||||||||||||||||||||||||||||||||||||||||||||
- Manage risk to capital
- Seeks to provide attractive returns and long-term growth of capital
- Typically invests in large-cap domestic and foreign securities with improving fundamental growth trends
|
Prices
|
As of: 07/27/2018 | ||||
|---|---|---|---|---|---|
| Shares Outstanding | Fund Size ($M) | Closing Bid/Ask (Midpoint) | Daily Volume | Premium/Discount | Expense Ratio | |||||
|---|---|---|---|---|---|---|---|---|---|---|
|
|
|
|
|
1.06% |
|
Performance Month End
|
As of: 06/30/2018 | |||||
|---|---|---|---|---|---|---|
| Name | MTD | QTD | YTD | 1 Year | 3 Year | Since Inception 8/25/2014 | ||||||
|---|---|---|---|---|---|---|---|---|---|---|---|---|
| NAV |
|
|
|
|
|
|
||||||
| Market |
|
|
|
|
|
|
|
Performance Quarter End
|
As of: 06/30/2018 | |||||
|---|---|---|---|---|---|---|
| Name | MTD | QTD | YTD | 1 Year | 3 Year | Since Inception 8/25/2014 | ||||||
|---|---|---|---|---|---|---|---|---|---|---|---|---|
| NAV |
|
|
|
|
|
|
||||||
| Market |
|
|
|
|
|
|
Returns are average annualized total returns, except those for periods of less than one year, which are cumulative. The performance data quoted represents past performance and is not a guarantee of future results. Investment return and principal value of an investment will fluctuate so that an investor's shares, when redeemed, may be worth more or less than their original cost. For most recent month-end performance, please see the monthly performance tab.
|
Fund Characteristics
|
As of: 6/30/2018 |
|---|
| 30-Day SEC Yield | |
|---|---|
|
|
WBIE Top Holdings
|
As of: 07/30/2018 | |
|---|---|---|
| Security Name | Weightings | Shares | ||||||||||||||||||||||||||||||
|---|---|---|---|---|---|---|---|---|---|---|---|---|---|---|---|---|---|---|---|---|---|---|---|---|---|---|---|---|---|---|---|---|
|
|
|

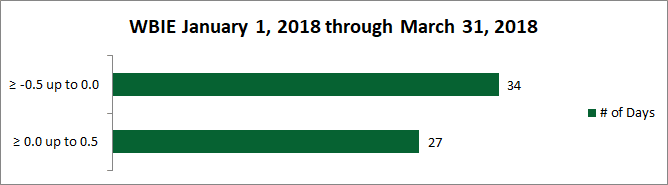
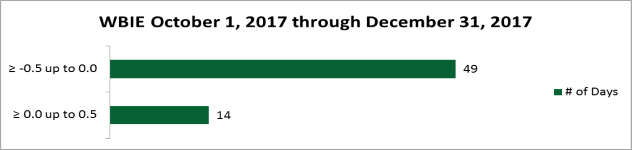
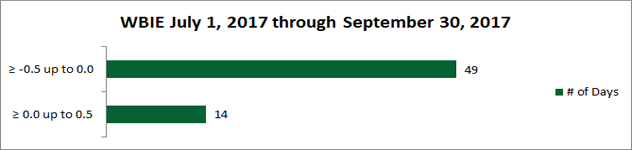
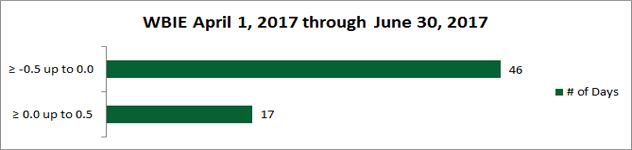
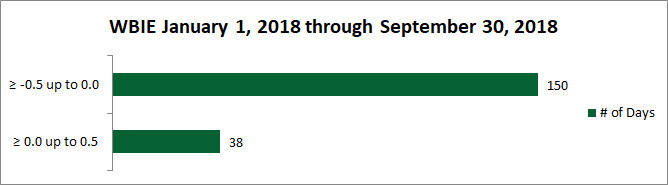

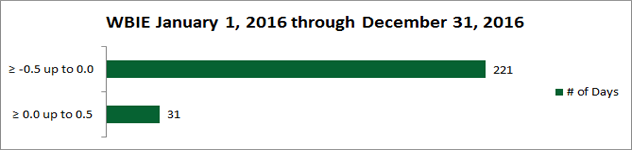
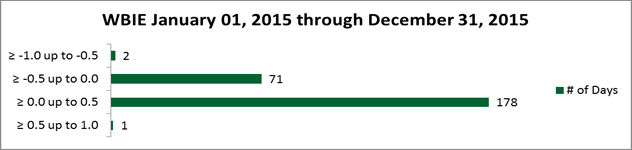
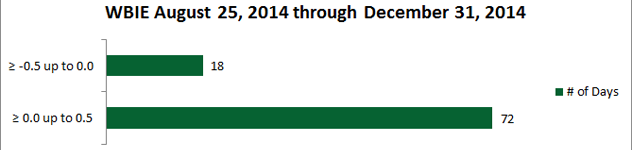

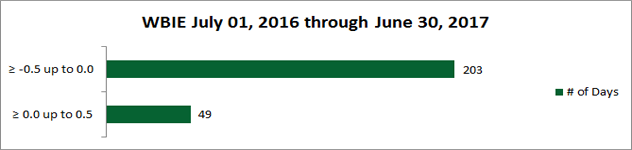

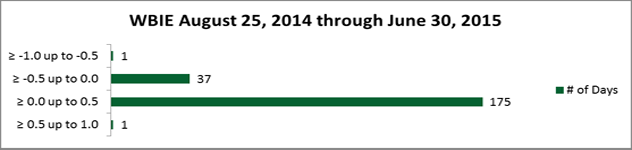
The chart above shows the difference between the daily price for shares of the Fund and the Fund’s NAV (net asset value). The daily price is determined using the midpoint between the highest bid and the lowest offer on the listing exchange, as of 4:00 p.m. EST (when NAV is normally determined for most ETFs). The premium or discount is presented on the vertical axis of the chart and is shown as a percentage of NAV. The number of trading days in the period covered by the chart is indicated on the horizontal axis. The bars in the chart display the number of trading days in which the Fund traded within the premium/discount range shown. The horizontal bar for the range of ≥0.0 up to 0.5 includes the days that the Fund’s daily price matched its NAV (i.e. there was no premium or discount).
|
Fund Information
|
As of: 07/27/2018 | ||||||||||||||||||||||||||||||||||||||||||||||||||||||||||||||||||||||||||||||||||||||||||||||||||||||||||||||||||||||||||||||||||||||||||||||||||||||||||||||||||||||||||||||||||||||||||||||||||||||||||||||||||||||||||||||||||||||||||||||||||||||||||||||||||||||||||||||||||||||||||||||||||||||||||||||||||||||||||||||||||||||||||||||||||||||||||||||||||||||||||||||||||||||||||||||||||||||||||||||||||||||||||||||||||||||||
|---|---|---|---|---|---|---|---|---|---|---|---|---|---|---|---|---|---|---|---|---|---|---|---|---|---|---|---|---|---|---|---|---|---|---|---|---|---|---|---|---|---|---|---|---|---|---|---|---|---|---|---|---|---|---|---|---|---|---|---|---|---|---|---|---|---|---|---|---|---|---|---|---|---|---|---|---|---|---|---|---|---|---|---|---|---|---|---|---|---|---|---|---|---|---|---|---|---|---|---|---|---|---|---|---|---|---|---|---|---|---|---|---|---|---|---|---|---|---|---|---|---|---|---|---|---|---|---|---|---|---|---|---|---|---|---|---|---|---|---|---|---|---|---|---|---|---|---|---|---|---|---|---|---|---|---|---|---|---|---|---|---|---|---|---|---|---|---|---|---|---|---|---|---|---|---|---|---|---|---|---|---|---|---|---|---|---|---|---|---|---|---|---|---|---|---|---|---|---|---|---|---|---|---|---|---|---|---|---|---|---|---|---|---|---|---|---|---|---|---|---|---|---|---|---|---|---|---|---|---|---|---|---|---|---|---|---|---|---|---|---|---|---|---|---|---|---|---|---|---|---|---|---|---|---|---|---|---|---|---|---|---|---|---|---|---|---|---|---|---|---|---|---|---|---|---|---|---|---|---|---|---|---|---|---|---|---|---|---|---|---|---|---|---|---|---|---|---|---|---|---|---|---|---|---|---|---|---|---|---|---|---|---|---|---|---|---|---|---|---|---|---|---|---|---|---|---|---|---|---|---|---|---|---|---|---|---|---|---|---|---|---|---|---|---|---|---|---|---|---|---|---|---|---|---|---|---|---|---|---|---|---|---|---|---|---|---|---|---|---|---|---|---|---|---|---|---|---|---|---|---|---|---|---|---|---|---|---|---|---|---|---|---|---|---|---|---|---|---|---|---|---|---|---|---|---|---|---|---|---|---|---|---|---|---|---|---|---|---|---|---|---|---|---|---|---|
| NAV | Daily Change | Fact Sheet | Holdings | ||||||||||||||||||||||||||||||||||||||||||||||||||||||||||||||||||||||||||||||||||||||||||||||||||||||||||||||||||||||||||||||||||||||||||||||||||||||||||||||||||||||||||||||||||||||||||||||||||||||||||||||||||||||||||||||||||||||||||||||||||||||||||||||||||||||||||||||||||||||||||||||||||||||||||||||||||||||||||||||||||||||||||||||||||||||||||||||||||||||||||||||||||||||||||||||||||||||||||||||||||||||||||||||||||||||
|
|
|
|
||||||||||||||||||||||||||||||||||||||||||||||||||||||||||||||||||||||||||||||||||||||||||||||||||||||||||||||||||||||||||||||||||||||||||||||||||||||||||||||||||||||||||||||||||||||||||||||||||||||||||||||||||||||||||||||||||||||||||||||||||||||||||||||||||||||||||||||||||||||||||||||||||||||||||||||||||||||||||||||||||||||||||||||||||||||||||||||||||||||||||||||||||||||||||||||||||||||||||||||||||||||||||||||||||||||
- Manage risk to capital
- Seeks to provide attractive returns and long-term growth of capital
- Typically invests in large-cap domestic and foreign securities with consistent fundamentals and strong value characteristics
|
Prices
|
As of: 07/27/2018 | ||||
|---|---|---|---|---|---|
| Shares Outstanding | Fund Size ($M) | Closing Bid/Ask (Midpoint) | Daily Volume | Premium/Discount | Expense Ratio | |||||
|---|---|---|---|---|---|---|---|---|---|---|
|
|
|
|
|
1.04% |
|
Performance Month End
|
As of: 06/30/2018 | |||||
|---|---|---|---|---|---|---|
| Name | MTD | QTD | YTD | 1 Year | 3 Year | Since Inception 8/25/2014 | ||||||
|---|---|---|---|---|---|---|---|---|---|---|---|---|
| NAV |
|
|
|
|
|
|
||||||
| Market |
|
|
|
|
|
|
|
Performance Quarter End
|
As of: 06/30/2018 | |||||
|---|---|---|---|---|---|---|
| Name | MTD | QTD | YTD | 1 Year | 3 Year | Since Inception 8/25/2014 | ||||||
|---|---|---|---|---|---|---|---|---|---|---|---|---|
| NAV |
|
|
|
|
|
|
||||||
| Market |
|
|
|
|
|
|
Returns are average annualized total returns, except those for periods of less than one year, which are cumulative. The performance data quoted represents past performance and is not a guarantee of future results. Investment return and principal value of an investment will fluctuate so that an investor's shares, when redeemed, may be worth more or less than their original cost. For most recent month-end performance, please see the monthly performance tab.
|
Fund Characteristics
|
As of: 6/30/2018 |
|---|
| 30-Day SEC Yield | |
|---|---|
|
|
WBIF Top Holdings
|
As of: 07/30/2018 | |
|---|---|---|
| Security Name | Weightings | Shares | ||||||||||||||||||||||||||||||
|---|---|---|---|---|---|---|---|---|---|---|---|---|---|---|---|---|---|---|---|---|---|---|---|---|---|---|---|---|---|---|---|---|
|
|
|
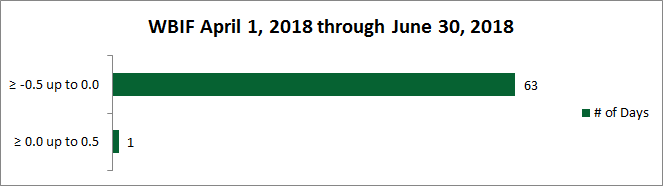
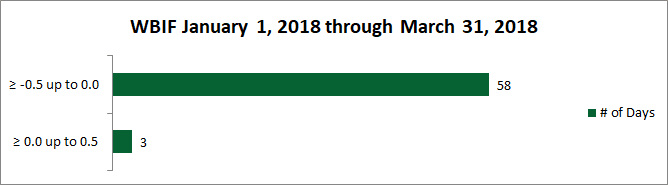

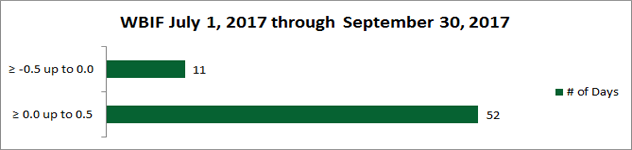
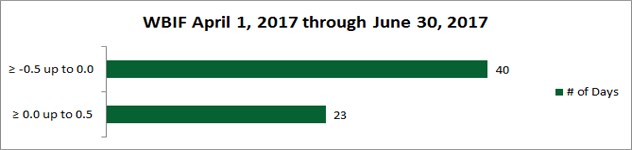
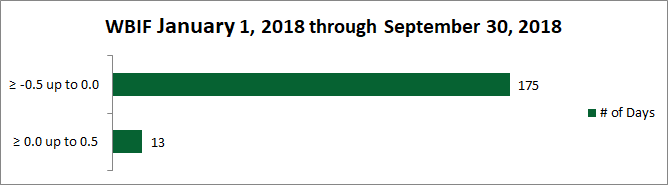
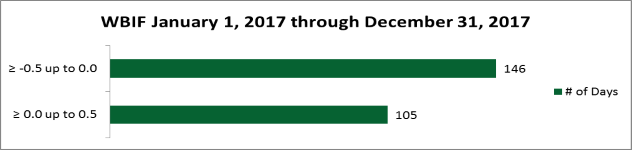

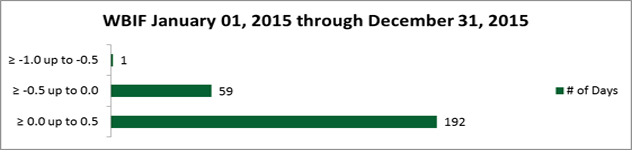
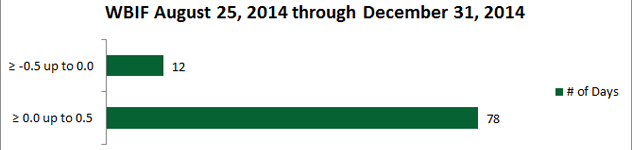
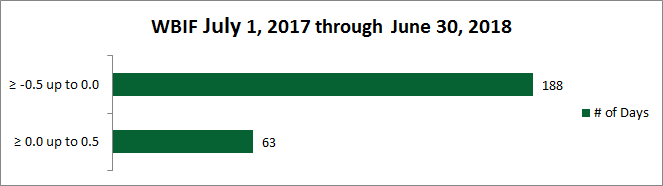
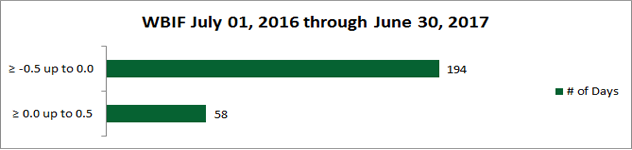


The chart above shows the difference between the daily price for shares of the Fund and the Fund’s NAV (net asset value). The daily price is determined using the midpoint between the highest bid and the lowest offer on the listing exchange, as of 4:00 p.m. EST (when NAV is normally determined for most ETFs). The premium or discount is presented on the vertical axis of the chart and is shown as a percentage of NAV. The number of trading days in the period covered by the chart is indicated on the horizontal axis. The bars in the chart display the number of trading days in which the Fund traded within the premium/discount range shown. The horizontal bar for the range of ≥0.0 up to 0.5 includes the days that the Fund’s daily price matched its NAV (i.e. there was no premium or discount).
|
Fund Information
|
As of: 07/27/2018 | ||||||||||||||||||||||||||||||||||||||||||||||||||||||||||||||||||||||||||||||||||||||||||||||||||||||||||||||||||||||||||||||||||||||||||||||||||||||||||||||||||||||||||||||||||||||||||||||||||||||||||||||||||||||||||||||||||||||||||||||||||||||||||||||||||||||||||||||||||||||||||||||||||||||||||||||||||||||||||||||||||||||||||||||||||||||||||||||||||||||||||||||||||||||||||||||||||||||||||||||||||||||||||
|---|---|---|---|---|---|---|---|---|---|---|---|---|---|---|---|---|---|---|---|---|---|---|---|---|---|---|---|---|---|---|---|---|---|---|---|---|---|---|---|---|---|---|---|---|---|---|---|---|---|---|---|---|---|---|---|---|---|---|---|---|---|---|---|---|---|---|---|---|---|---|---|---|---|---|---|---|---|---|---|---|---|---|---|---|---|---|---|---|---|---|---|---|---|---|---|---|---|---|---|---|---|---|---|---|---|---|---|---|---|---|---|---|---|---|---|---|---|---|---|---|---|---|---|---|---|---|---|---|---|---|---|---|---|---|---|---|---|---|---|---|---|---|---|---|---|---|---|---|---|---|---|---|---|---|---|---|---|---|---|---|---|---|---|---|---|---|---|---|---|---|---|---|---|---|---|---|---|---|---|---|---|---|---|---|---|---|---|---|---|---|---|---|---|---|---|---|---|---|---|---|---|---|---|---|---|---|---|---|---|---|---|---|---|---|---|---|---|---|---|---|---|---|---|---|---|---|---|---|---|---|---|---|---|---|---|---|---|---|---|---|---|---|---|---|---|---|---|---|---|---|---|---|---|---|---|---|---|---|---|---|---|---|---|---|---|---|---|---|---|---|---|---|---|---|---|---|---|---|---|---|---|---|---|---|---|---|---|---|---|---|---|---|---|---|---|---|---|---|---|---|---|---|---|---|---|---|---|---|---|---|---|---|---|---|---|---|---|---|---|---|---|---|---|---|---|---|---|---|---|---|---|---|---|---|---|---|---|---|---|---|---|---|---|---|---|---|---|---|---|---|---|---|---|---|---|---|---|---|---|---|---|---|---|---|---|---|---|---|---|---|---|---|---|---|---|---|---|---|---|---|---|---|---|---|---|---|---|---|---|---|---|---|---|---|---|---|---|---|---|---|---|---|---|---|---|---|---|---|---|---|---|
| NAV | Daily Change | Fact Sheet | Holdings | ||||||||||||||||||||||||||||||||||||||||||||||||||||||||||||||||||||||||||||||||||||||||||||||||||||||||||||||||||||||||||||||||||||||||||||||||||||||||||||||||||||||||||||||||||||||||||||||||||||||||||||||||||||||||||||||||||||||||||||||||||||||||||||||||||||||||||||||||||||||||||||||||||||||||||||||||||||||||||||||||||||||||||||||||||||||||||||||||||||||||||||||||||||||||||||||||||||||||||||||||||||||||
|
|
|
|
||||||||||||||||||||||||||||||||||||||||||||||||||||||||||||||||||||||||||||||||||||||||||||||||||||||||||||||||||||||||||||||||||||||||||||||||||||||||||||||||||||||||||||||||||||||||||||||||||||||||||||||||||||||||||||||||||||||||||||||||||||||||||||||||||||||||||||||||||||||||||||||||||||||||||||||||||||||||||||||||||||||||||||||||||||||||||||||||||||||||||||||||||||||||||||||||||||||||||||||||||||||||
- Manage risk to capital
- Generate an attractive current yield that helps to promote compounding
- Seeks to provide attractive returns and long-term growth of capital
- Typically invests in large-cap domestic and foreign securities that present themselves as undervalued opportunities with attractive dividend yields
|
Prices
|
As of: 07/27/2018 | ||||
|---|---|---|---|---|---|
| Shares Outstanding | Fund Size ($M) | Closing Bid/Ask (Midpoint) | Daily Volume | Premium/Discount | Expense Ratio | |||||
|---|---|---|---|---|---|---|---|---|---|---|
|
|
|
|
|
1.04% |
|
Performance Month End
|
As of: 06/30/2018 | |||||
|---|---|---|---|---|---|---|
| Name | MTD | QTD | YTD | 1 Year | 3 Year | Since Inception 8/25/2014 | ||||||
|---|---|---|---|---|---|---|---|---|---|---|---|---|
| NAV |
|
|
|
|
|
|
||||||
| Market |
|
|
|
|
|
|
|
Performance Quarter End
|
As of: 06/30/2018 | |||||
|---|---|---|---|---|---|---|
| Name | MTD | QTD | YTD | 1 Year | 3 Year | Since Inception 8/25/2014 | ||||||
|---|---|---|---|---|---|---|---|---|---|---|---|---|
| NAV |
|
|
|
|
|
|
||||||
| Market |
|
|
|
|
|
|
Returns are average annualized total returns, except those for periods of less than one year, which are cumulative. The performance data quoted represents past performance and is not a guarantee of future results. Investment return and principal value of an investment will fluctuate so that an investor's shares, when redeemed, may be worth more or less than their original cost. For most recent month-end performance, please see the monthly performance tab.
|
Fund Characteristics
|
As of: 6/30/2018 |
|---|
| 30-Day SEC Yield | |
|---|---|
|
|
WBIG Top Holdings
|
As of: 07/30/2018 | |
|---|---|---|
| Security Name | Weightings | Shares | ||||||||||||||||||||||||||||||
|---|---|---|---|---|---|---|---|---|---|---|---|---|---|---|---|---|---|---|---|---|---|---|---|---|---|---|---|---|---|---|---|---|
|
|
|
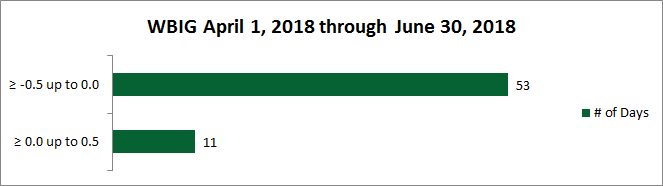

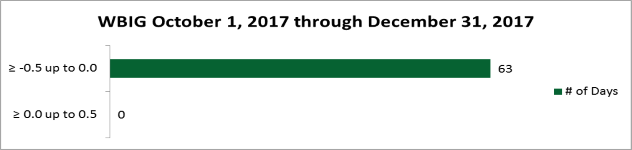
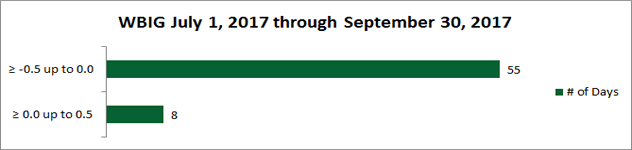
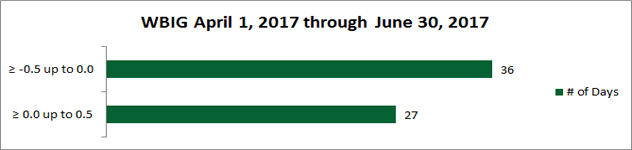

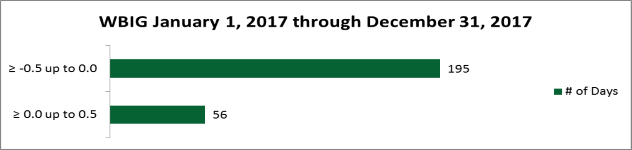
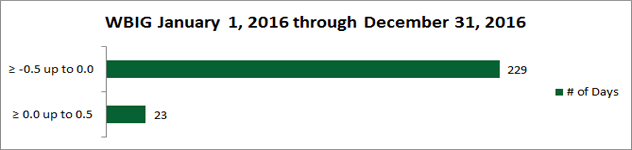
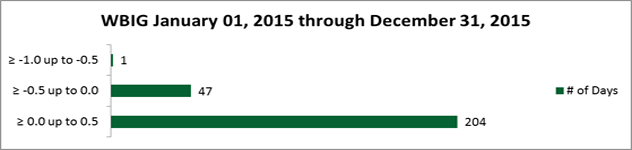
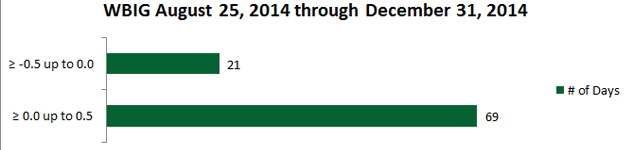
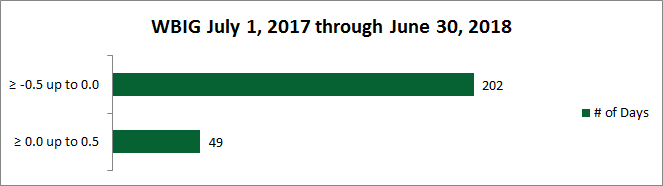
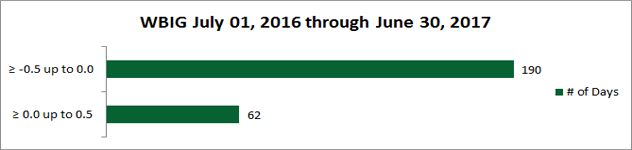
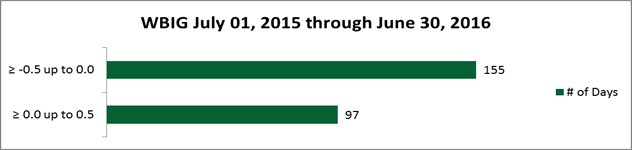
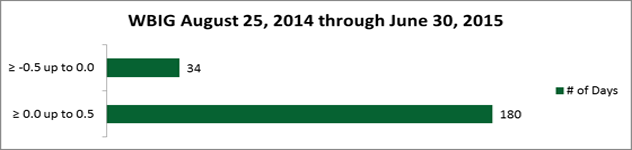
The chart above shows the difference between the daily price for shares of the Fund and the Fund’s NAV (net asset value). The daily price is determined using the midpoint between the highest bid and the lowest offer on the listing exchange, as of 4:00 p.m. EST (when NAV is normally determined for most ETFs). The premium or discount is presented on the vertical axis of the chart and is shown as a percentage of NAV. The number of trading days in the period covered by the chart is indicated on the horizontal axis. The bars in the chart display the number of trading days in which the Fund traded within the premium/discount range shown. The horizontal bar for the range of ≥0.0 up to 0.5 includes the days that the Fund’s daily price matched its NAV (i.e. there was no premium or discount).
|
Fund Information
|
As of: 07/27/2018 | ||||||||||||||||||||||||||||||||||||||||||||||||||||||||||||||||||||||||||||||||||||||||||||||||||||||||||||||||||||||||||||||||||||||||||||||||||||||||||||||||||||||||||||||||||||||||||||||||||||||||||||||||||||||||||||||||||||||||||||||||||||||||||||||||||||||||||||||||||||||||||||||||||||||||||||||||||||||||||||||||||||||||||||||||||||||||||||||||||||||||||||||||||||||||||||||||||||||||||||||||||||||||||
|---|---|---|---|---|---|---|---|---|---|---|---|---|---|---|---|---|---|---|---|---|---|---|---|---|---|---|---|---|---|---|---|---|---|---|---|---|---|---|---|---|---|---|---|---|---|---|---|---|---|---|---|---|---|---|---|---|---|---|---|---|---|---|---|---|---|---|---|---|---|---|---|---|---|---|---|---|---|---|---|---|---|---|---|---|---|---|---|---|---|---|---|---|---|---|---|---|---|---|---|---|---|---|---|---|---|---|---|---|---|---|---|---|---|---|---|---|---|---|---|---|---|---|---|---|---|---|---|---|---|---|---|---|---|---|---|---|---|---|---|---|---|---|---|---|---|---|---|---|---|---|---|---|---|---|---|---|---|---|---|---|---|---|---|---|---|---|---|---|---|---|---|---|---|---|---|---|---|---|---|---|---|---|---|---|---|---|---|---|---|---|---|---|---|---|---|---|---|---|---|---|---|---|---|---|---|---|---|---|---|---|---|---|---|---|---|---|---|---|---|---|---|---|---|---|---|---|---|---|---|---|---|---|---|---|---|---|---|---|---|---|---|---|---|---|---|---|---|---|---|---|---|---|---|---|---|---|---|---|---|---|---|---|---|---|---|---|---|---|---|---|---|---|---|---|---|---|---|---|---|---|---|---|---|---|---|---|---|---|---|---|---|---|---|---|---|---|---|---|---|---|---|---|---|---|---|---|---|---|---|---|---|---|---|---|---|---|---|---|---|---|---|---|---|---|---|---|---|---|---|---|---|---|---|---|---|---|---|---|---|---|---|---|---|---|---|---|---|---|---|---|---|---|---|---|---|---|---|---|---|---|---|---|---|---|---|---|---|---|---|---|---|---|---|---|---|---|---|---|---|---|---|---|---|---|---|---|---|---|---|---|---|---|---|---|---|---|---|---|---|---|---|---|---|---|---|---|---|---|---|---|---|
| NAV | Daily Change | Fact Sheet | Holdings | ||||||||||||||||||||||||||||||||||||||||||||||||||||||||||||||||||||||||||||||||||||||||||||||||||||||||||||||||||||||||||||||||||||||||||||||||||||||||||||||||||||||||||||||||||||||||||||||||||||||||||||||||||||||||||||||||||||||||||||||||||||||||||||||||||||||||||||||||||||||||||||||||||||||||||||||||||||||||||||||||||||||||||||||||||||||||||||||||||||||||||||||||||||||||||||||||||||||||||||||||||||||||
|
|
|
|
||||||||||||||||||||||||||||||||||||||||||||||||||||||||||||||||||||||||||||||||||||||||||||||||||||||||||||||||||||||||||||||||||||||||||||||||||||||||||||||||||||||||||||||||||||||||||||||||||||||||||||||||||||||||||||||||||||||||||||||||||||||||||||||||||||||||||||||||||||||||||||||||||||||||||||||||||||||||||||||||||||||||||||||||||||||||||||||||||||||||||||||||||||||||||||||||||||||||||||||||||||||||
- Manage risk to capital
- Seeks to provide attractive returns and long-term growth of capital
- Typically invests in large-cap domestic and foreign securities with attractive value characteristics and prospects for financial stability
|
Prices
|
As of: 07/27/2018 | ||||
|---|---|---|---|---|---|
| Shares Outstanding | Fund Size ($M) | Closing Bid/Ask (Midpoint) | Daily Volume | Premium/Discount | Expense Ratio | |||||
|---|---|---|---|---|---|---|---|---|---|---|
|
|
|
|
|
1.05% |
|
Performance Month End
|
As of: 06/30/2018 | |||||
|---|---|---|---|---|---|---|
| Name | MTD | QTD | YTD | 1 Year | 3 Year | Since Inception 8/25/2014 | ||||||
|---|---|---|---|---|---|---|---|---|---|---|---|---|
| NAV |
|
|
|
|
|
|
||||||
| Market |
|
|
|
|
|
|
|
Performance Quarter End
|
As of: 06/30/2018 | |||||
|---|---|---|---|---|---|---|
| Name | MTD | QTD | YTD | 1 Year | 3 Year | Since Inception 8/25/2014 | ||||||
|---|---|---|---|---|---|---|---|---|---|---|---|---|
| NAV |
|
|
|
|
|
|
||||||
| Market |
|
|
|
|
|
|
Returns are average annualized total returns, except those for periods of less than one year, which are cumulative. The performance data quoted represents past performance and is not a guarantee of future results. Investment return and principal value of an investment will fluctuate so that an investor's shares, when redeemed, may be worth more or less than their original cost. For most recent month-end performance, please see the monthly performance tab.
|
Fund Characteristics
|
As of: 6/30/2018 |
|---|
| 30-Day SEC Yield | |
|---|---|
|
|
WBIL Top Holdings
|
As of: 07/30/2018 | |
|---|---|---|
| Security Name | Weightings | Shares | ||||||||||||||||||||||||||||||
|---|---|---|---|---|---|---|---|---|---|---|---|---|---|---|---|---|---|---|---|---|---|---|---|---|---|---|---|---|---|---|---|---|
|
|
|
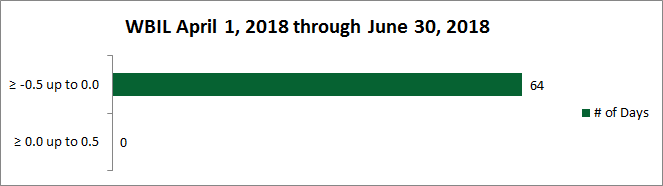
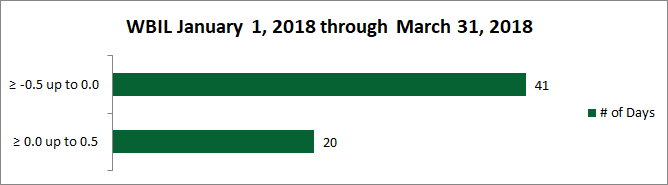
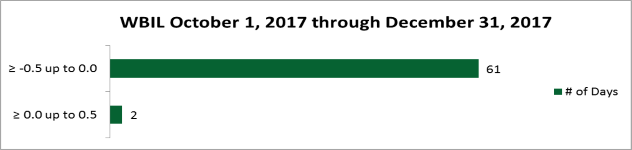
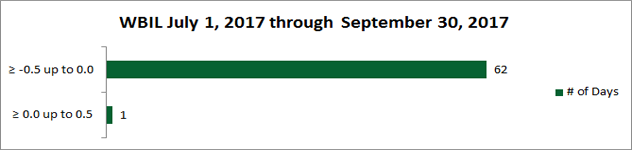
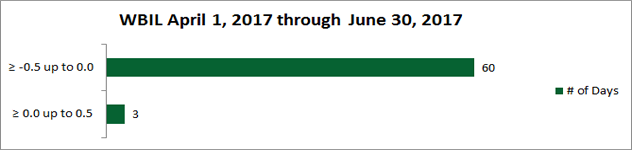
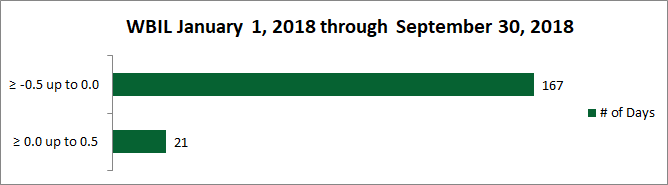
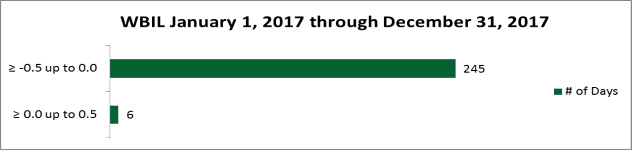

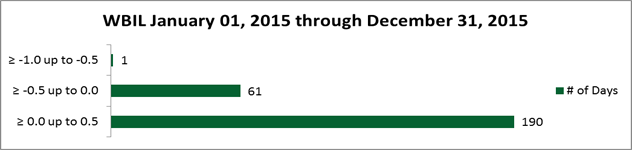
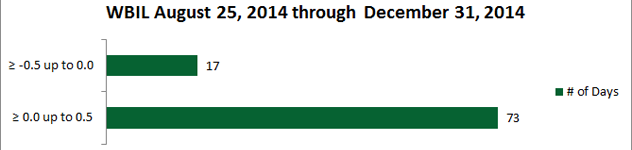
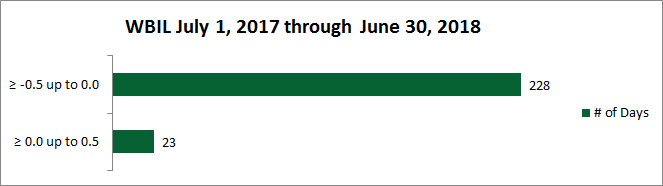
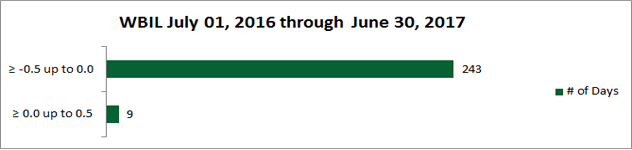
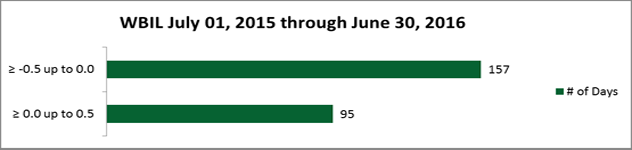
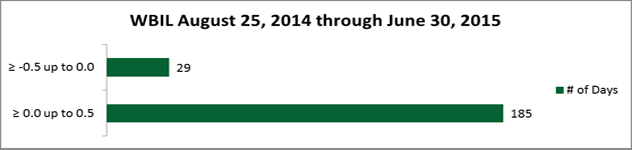
The chart above shows the difference between the daily price for shares of the Fund and the Fund’s NAV (net asset value). The daily price is determined using the midpoint between the highest bid and the lowest offer on the listing exchange, as of 4:00 p.m. EST (when NAV is normally determined for most ETFs). The premium or discount is presented on the vertical axis of the chart and is shown as a percentage of NAV. The number of trading days in the period covered by the chart is indicated on the horizontal axis. The bars in the chart display the number of trading days in which the Fund traded within the premium/discount range shown. The horizontal bar for the range of ≥0.0 up to 0.5 includes the days that the Fund’s daily price matched its NAV (i.e. there was no premium or discount).
|
Fund Information
|
As of: 07/27/2018 | ||||||||||||||||||||||||||||||||||||||||||||||||||||||||||||||||||||||||||||||||||||||||||||||||||||||||||||||||||||||||||||||||||
|---|---|---|---|---|---|---|---|---|---|---|---|---|---|---|---|---|---|---|---|---|---|---|---|---|---|---|---|---|---|---|---|---|---|---|---|---|---|---|---|---|---|---|---|---|---|---|---|---|---|---|---|---|---|---|---|---|---|---|---|---|---|---|---|---|---|---|---|---|---|---|---|---|---|---|---|---|---|---|---|---|---|---|---|---|---|---|---|---|---|---|---|---|---|---|---|---|---|---|---|---|---|---|---|---|---|---|---|---|---|---|---|---|---|---|---|---|---|---|---|---|---|---|---|---|---|---|---|---|---|---|---|
| NAV | Daily Change | Fact Sheet | Holdings | ||||||||||||||||||||||||||||||||||||||||||||||||||||||||||||||||||||||||||||||||||||||||||||||||||||||||||||||||||||||||||||||||
|
|
|
|
||||||||||||||||||||||||||||||||||||||||||||||||||||||||||||||||||||||||||||||||||||||||||||||||||||||||||||||||||||||||||||||||
- Manage risk to capital
- Generate high current yield that helps to promote compounding
- Seeks to provide attractive returns and long-term growth of capital
- Typically invests in income-producing debt and equity securities of foreign and domestic companies
|
Prices
|
As of: 07/27/2018 | ||||
|---|---|---|---|---|---|
| Shares Outstanding | Fund Size ($M) | Closing Bid/Ask (Midpoint) | Daily Volume | Premium/Discount | Expense Ratio | |||||
|---|---|---|---|---|---|---|---|---|---|---|
|
|
|
|
|
1.17% |
|
Performance Month End
|
As of: 06/30/2018 | |||||
|---|---|---|---|---|---|---|
| Name | MTD | QTD | YTD | 1 Year | 3 Year | Since Inception 8/25/2014 | ||||||
|---|---|---|---|---|---|---|---|---|---|---|---|---|
| NAV |
|
|
|
|
|
|
||||||
| Market |
|
|
|
|
|
|
|
Performance Quarter End
|
As of: 06/30/2018 | |||||
|---|---|---|---|---|---|---|
| Name | MTD | QTD | YTD | 1 Year | 3 Year | Since Inception 8/25/2014 | ||||||
|---|---|---|---|---|---|---|---|---|---|---|---|---|
| NAV |
|
|
|
|
|
|
||||||
| Market |
|
|
|
|
|
|
Returns are average annualized total returns, except those for periods of less than one year, which are cumulative. The performance data quoted represents past performance and is not a guarantee of future results. Investment return and principal value of an investment will fluctuate so that an investor's shares, when redeemed, may be worth more or less than their original cost. For most recent month-end performance, please see the monthly performance tab.
|
Fund Characteristics
|
As of: 6/30/2018 |
|---|
| 30-Day SEC Yield | |
|---|---|
|
|
WBII Top Holdings
|
As of: 07/30/2018 | |
|---|---|---|
| Security Name | Weightings | Shares | ||||||||||||||||||||||||
|---|---|---|---|---|---|---|---|---|---|---|---|---|---|---|---|---|---|---|---|---|---|---|---|---|---|---|
|
|
|

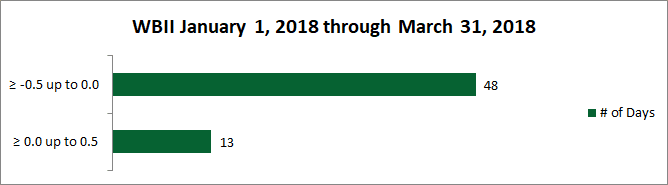
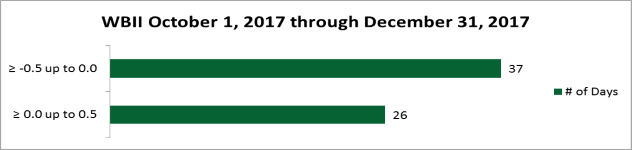
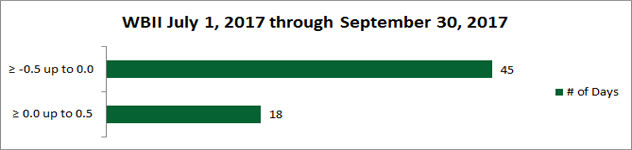
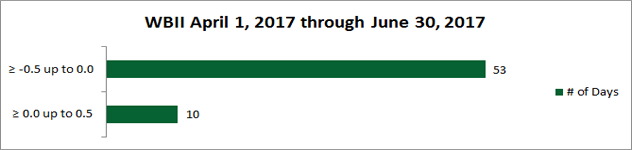
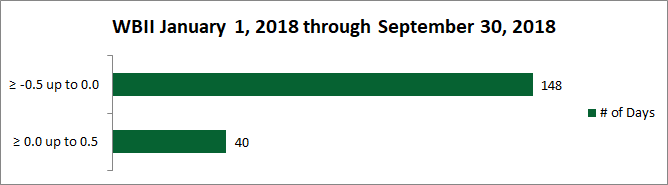
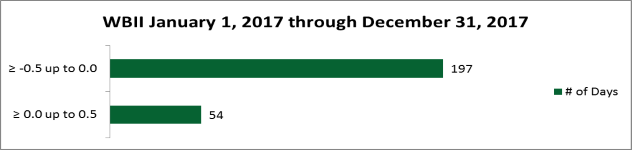
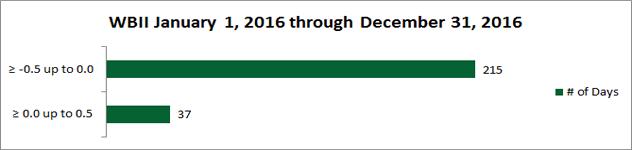

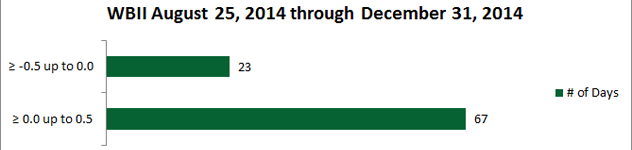
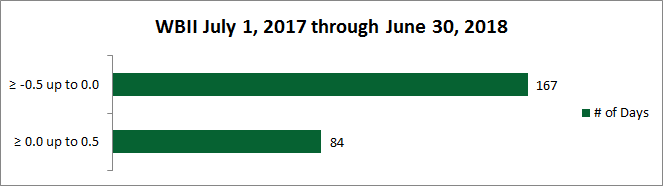
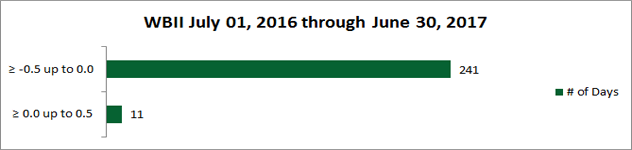
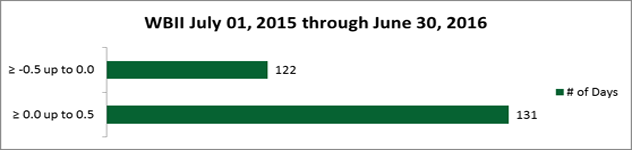

The chart above shows the difference between the daily price for shares of the Fund and the Fund’s NAV (net asset value). The daily price is determined using the midpoint between the highest bid and the lowest offer on the listing exchange, as of 4:00 p.m. EST (when NAV is normally determined for most ETFs). The premium or discount is presented on the vertical axis of the chart and is shown as a percentage of NAV. The number of trading days in the period covered by the chart is indicated on the horizontal axis. The bars in the chart display the number of trading days in which the Fund traded within the premium/discount range shown. The horizontal bar for the range of ≥0.0 up to 0.5 includes the days that the Fund’s daily price matched its NAV (i.e. there was no premium or discount).
|
Fund Information
|
As of: 07/27/2018 | ||||||||||||||||||||||||||||||||||||||||||||||||||||||||||||||||||||||||||||||||||||||||||||||||||||||||||||||||||||||||||||||||||||||||||||||||||||||||||||||||||||||||||||||||||||||||||||||||||||||||||||||||||||||||||||||||||||||||||||||||||||||||||||||||||||||||||||||||||||||||||||||||||||||||||||||||||||||||||||||||||||||||||||||||||||||||||||||||||
|---|---|---|---|---|---|---|---|---|---|---|---|---|---|---|---|---|---|---|---|---|---|---|---|---|---|---|---|---|---|---|---|---|---|---|---|---|---|---|---|---|---|---|---|---|---|---|---|---|---|---|---|---|---|---|---|---|---|---|---|---|---|---|---|---|---|---|---|---|---|---|---|---|---|---|---|---|---|---|---|---|---|---|---|---|---|---|---|---|---|---|---|---|---|---|---|---|---|---|---|---|---|---|---|---|---|---|---|---|---|---|---|---|---|---|---|---|---|---|---|---|---|---|---|---|---|---|---|---|---|---|---|---|---|---|---|---|---|---|---|---|---|---|---|---|---|---|---|---|---|---|---|---|---|---|---|---|---|---|---|---|---|---|---|---|---|---|---|---|---|---|---|---|---|---|---|---|---|---|---|---|---|---|---|---|---|---|---|---|---|---|---|---|---|---|---|---|---|---|---|---|---|---|---|---|---|---|---|---|---|---|---|---|---|---|---|---|---|---|---|---|---|---|---|---|---|---|---|---|---|---|---|---|---|---|---|---|---|---|---|---|---|---|---|---|---|---|---|---|---|---|---|---|---|---|---|---|---|---|---|---|---|---|---|---|---|---|---|---|---|---|---|---|---|---|---|---|---|---|---|---|---|---|---|---|---|---|---|---|---|---|---|---|---|---|---|---|---|---|---|---|---|---|---|---|---|---|---|---|---|---|---|---|---|---|---|---|---|---|---|---|---|---|---|---|---|---|---|---|---|---|---|---|---|---|---|---|---|---|---|---|---|---|---|---|---|---|---|---|---|---|---|---|---|---|---|
| NAV | Daily Change | Fact Sheet | Holdings | ||||||||||||||||||||||||||||||||||||||||||||||||||||||||||||||||||||||||||||||||||||||||||||||||||||||||||||||||||||||||||||||||||||||||||||||||||||||||||||||||||||||||||||||||||||||||||||||||||||||||||||||||||||||||||||||||||||||||||||||||||||||||||||||||||||||||||||||||||||||||||||||||||||||||||||||||||||||||||||||||||||||||||||||||||||||||||||||||
|
|
|
|
||||||||||||||||||||||||||||||||||||||||||||||||||||||||||||||||||||||||||||||||||||||||||||||||||||||||||||||||||||||||||||||||||||||||||||||||||||||||||||||||||||||||||||||||||||||||||||||||||||||||||||||||||||||||||||||||||||||||||||||||||||||||||||||||||||||||||||||||||||||||||||||||||||||||||||||||||||||||||||||||||||||||||||||||||||||||||||||||
- Manage risk to capital
- Generate high current yield that helps to promote compounding
- Seeks to provide attractive returns and long-term growth of capital
- Typically invests in income-producing debt and equity securities of foreign and domestic companies
|
Prices
|
As of: 07/27/2018 | ||||
|---|---|---|---|---|---|
| Shares Outstanding | Fund Size ($M) | Closing Bid/Ask (Midpoint) | Daily Volume | Premium/Discount | Expense Ratio | |||||
|---|---|---|---|---|---|---|---|---|---|---|
|
|
|
|
|
1.21% |
|
Performance Month End
|
As of: 06/30/2018 | |||||
|---|---|---|---|---|---|---|
| Name | MTD | QTD | YTD | 1 Year | 3 Year | Since Inception 8/25/2014 | ||||||
|---|---|---|---|---|---|---|---|---|---|---|---|---|
| NAV |
|
|
|
|
|
|
||||||
| Market |
|
|
|
|
|
|
|
Performance Quarter End
|
As of: 06/30/2018 | |||||
|---|---|---|---|---|---|---|
| Name | MTD | QTD | YTD | 1 Year | 3 Year | Since Inception 8/25/2014 | ||||||
|---|---|---|---|---|---|---|---|---|---|---|---|---|
| NAV |
|
|
|
|
|
|
||||||
| Market |
|
|
|
|
|
|
Returns are average annualized total returns, except those for periods of less than one year, which are cumulative. The performance data quoted represents past performance and is not a guarantee of future results. Investment return and principal value of an investment will fluctuate so that an investor's shares, when redeemed, may be worth more or less than their original cost. For most recent month-end performance, please see the monthly performance tab.
|
Fund Characteristics
|
As of: 6/30/2018 |
|---|
| 30-Day SEC Yield | |
|---|---|
|
|
WBIH Top Holdings
|
As of: 07/30/2018 | |
|---|---|---|
| Security Name | Weightings | Shares | ||||||||||||||||||||||||||||||
|---|---|---|---|---|---|---|---|---|---|---|---|---|---|---|---|---|---|---|---|---|---|---|---|---|---|---|---|---|---|---|---|---|
|
|
|
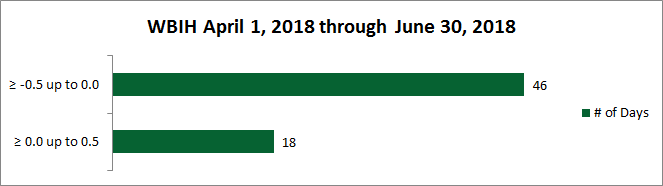

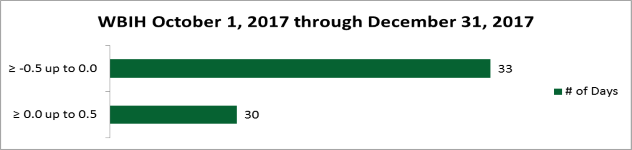
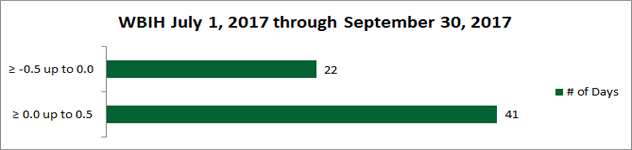
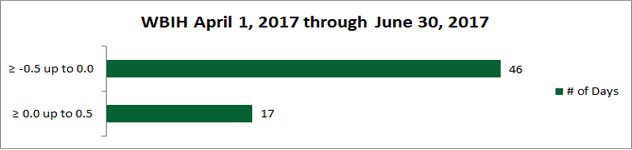
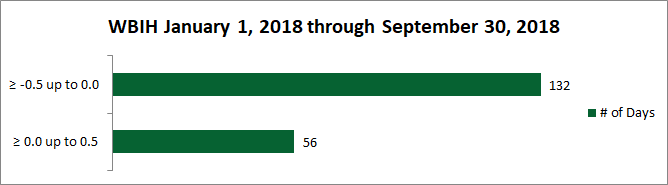
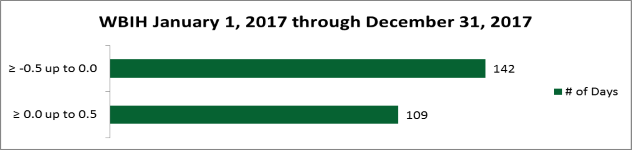
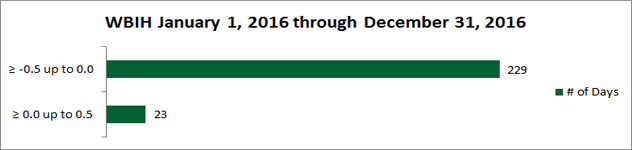
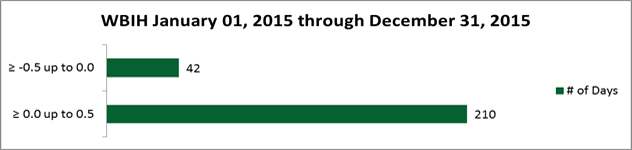
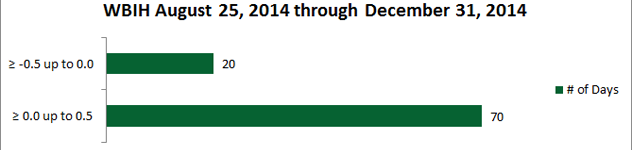
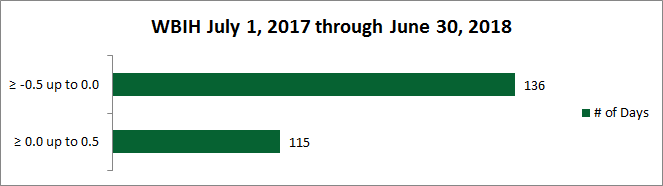
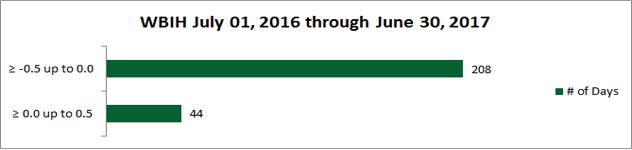
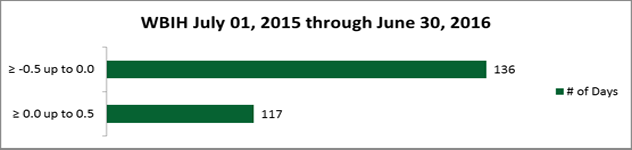

The chart above shows the difference between the daily price for shares of the Fund and the Fund’s NAV (net asset value). The daily price is determined using the midpoint between the highest bid and the lowest offer on the listing exchange, as of 4:00 p.m. EST (when NAV is normally determined for most ETFs). The premium or discount is presented on the vertical axis of the chart and is shown as a percentage of NAV. The number of trading days in the period covered by the chart is indicated on the horizontal axis. The bars in the chart display the number of trading days in which the Fund traded within the premium/discount range shown. The horizontal bar for the range of ≥0.0 up to 0.5 includes the days that the Fund’s daily price matched its NAV (i.e. there was no premium or discount).
|
Fund Information
|
As of: 07/27/2018 | ||||||||||||||||||||||||||||||||||||||||||||||||||||||||||||||||||||||||||||||||||||||||||||||||||||||||||||||||||||||||||||||||||||||||||||||||||||||||||||||||||||||||||||||||||||||||||||||||||||||||||||||||||||||||||||||||||||
|---|---|---|---|---|---|---|---|---|---|---|---|---|---|---|---|---|---|---|---|---|---|---|---|---|---|---|---|---|---|---|---|---|---|---|---|---|---|---|---|---|---|---|---|---|---|---|---|---|---|---|---|---|---|---|---|---|---|---|---|---|---|---|---|---|---|---|---|---|---|---|---|---|---|---|---|---|---|---|---|---|---|---|---|---|---|---|---|---|---|---|---|---|---|---|---|---|---|---|---|---|---|---|---|---|---|---|---|---|---|---|---|---|---|---|---|---|---|---|---|---|---|---|---|---|---|---|---|---|---|---|---|---|---|---|---|---|---|---|---|---|---|---|---|---|---|---|---|---|---|---|---|---|---|---|---|---|---|---|---|---|---|---|---|---|---|---|---|---|---|---|---|---|---|---|---|---|---|---|---|---|---|---|---|---|---|---|---|---|---|---|---|---|---|---|---|---|---|---|---|---|---|---|---|---|---|---|---|---|---|---|---|---|---|---|---|---|---|---|---|---|---|---|---|---|---|---|---|---|---|
| NAV | Daily Change | Fact Sheet | Holdings | ||||||||||||||||||||||||||||||||||||||||||||||||||||||||||||||||||||||||||||||||||||||||||||||||||||||||||||||||||||||||||||||||||||||||||||||||||||||||||||||||||||||||||||||||||||||||||||||||||||||||||||||||||||||||||||||||||
|
|
|
|
||||||||||||||||||||||||||||||||||||||||||||||||||||||||||||||||||||||||||||||||||||||||||||||||||||||||||||||||||||||||||||||||||||||||||||||||||||||||||||||||||||||||||||||||||||||||||||||||||||||||||||||||||||||||||||||||||
- Strives to provide global asset rotation, high risk-adjusted returns, and protect capital during unfavorable periods
- May invest in any global asset class, geographic region, country, index, sector, industry, currency, or cash equivalents
|
Prices
|
As of: 07/27/2018 | ||||
|---|---|---|---|---|---|
| Shares Outstanding | Fund Size ($M) | Closing Bid/Ask (Midpoint) | Daily Volume | Premium/Discount | Expense Ratio | |||||
|---|---|---|---|---|---|---|---|---|---|---|
|
|
|
|
|
1.59% |
|
Performance Month End
|
As of: 06/30/2018 | |||||
|---|---|---|---|---|---|---|
| Name | MTD | QTD | YTD | 1 Year | 3 Year | Since Inception 7/25/2016 | ||||||
|---|---|---|---|---|---|---|---|---|---|---|---|---|
| NAV |
|
|
|
|
|
|||||||
| Market |
|
|
|
|
|
|
Performance Quarter End
|
As of: 06/30/2018 | |||||
|---|---|---|---|---|---|---|
| Name | MTD | QTD | YTD | 1 Year | 3 Year | Since Inception 7/25/2016 | ||||||
|---|---|---|---|---|---|---|---|---|---|---|---|---|
| NAV |
|
|
|
|
|
|||||||
| Market |
|
|
|
|
|
Returns are average annualized total returns, except those for periods of less than one year, which are cumulative. The performance data quoted represents past performance and is not a guarantee of future results. Investment return and principal value of an investment will fluctuate so that an investor's shares, when redeemed, may be worth more or less than their original cost. For most recent month-end performance, please see the monthly performance tab.
|
Fund Characteristics
|
As of: 6/30/2018 |
|---|
| 30-Day SEC Yield | 30-Day Unsubsidized SEC Yield | ||
|---|---|---|---|
|
|
|
WBIR Top Holdings
|
As of: 07/30/2018 | |
|---|---|---|
| Security Name | Weightings | Shares | ||||||||||||||||||||||||||||||
|---|---|---|---|---|---|---|---|---|---|---|---|---|---|---|---|---|---|---|---|---|---|---|---|---|---|---|---|---|---|---|---|---|
|
|
|
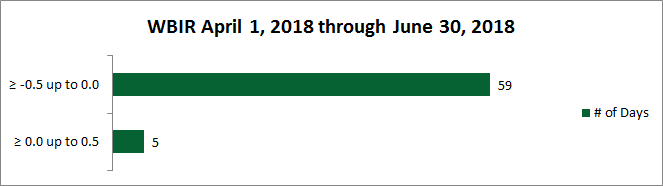
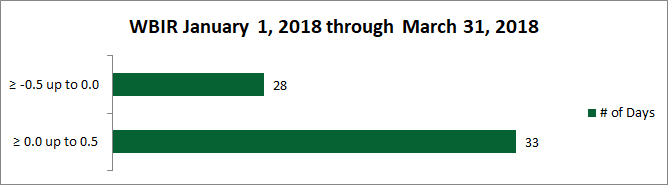
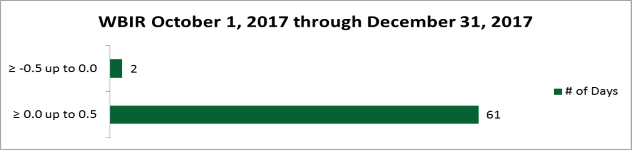


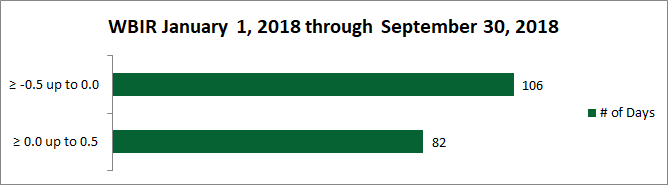
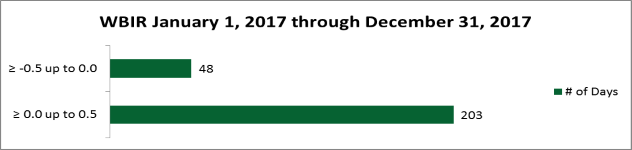
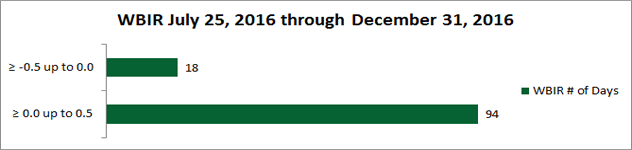

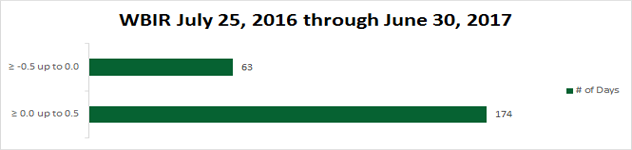
The chart above shows the difference between the daily price for shares of the Fund and the Fund’s NAV (net asset value). The daily price is determined using the midpoint between the highest bid and the lowest offer on the listing exchange, as of 4:00 p.m. EST (when NAV is normally determined for most ETFs). The premium or discount is presented on the vertical axis of the chart and is shown as a percentage of NAV. The number of trading days in the period covered by the chart is indicated on the horizontal axis. The bars in the chart display the number of trading days in which the Fund traded within the premium/discount range shown. The horizontal bar for the range of ≥0.0 up to 0.5 includes the days that the Fund’s daily price matched its NAV (i.e. there was no premium or discount).
|
Fund Information
|
As of: 07/27/2018 | ||||||||||||||||||||||||||||||||||||||||||||||||||||||||||||||||||||||||||||||||||||||||||||||||||||||||||||||||||||||||||||||||||||||||||||||||||||||||||||||||||||||||||||||||||||||||||||||||||||||||||||||||||||||||||||||||||||||||||||||||||||||||||||||||||||||||||||||||||||||||||||||||||||||||||||||||||||||||||||||||||||||||||||||||||||||||||||||||||||||||||||||||||||||||||||||||||||||||||||||||||||||||||||||||||||||||||||||||||||||||||||||||||||||||||||||||||||||||||||||||||||||||||||||||||||||||||||||||||||||||||||||||||||||||||||||||||||||||||||||||||||||||||||||||||||||||||||||||||||||||||||||||||||||||||||||||||||||||||||||||||||||||||||||||||||||||||||||||||||||||||||||||||||||||||||||||||||||||||||||||||||||||||||
|---|---|---|---|---|---|---|---|---|---|---|---|---|---|---|---|---|---|---|---|---|---|---|---|---|---|---|---|---|---|---|---|---|---|---|---|---|---|---|---|---|---|---|---|---|---|---|---|---|---|---|---|---|---|---|---|---|---|---|---|---|---|---|---|---|---|---|---|---|---|---|---|---|---|---|---|---|---|---|---|---|---|---|---|---|---|---|---|---|---|---|---|---|---|---|---|---|---|---|---|---|---|---|---|---|---|---|---|---|---|---|---|---|---|---|---|---|---|---|---|---|---|---|---|---|---|---|---|---|---|---|---|---|---|---|---|---|---|---|---|---|---|---|---|---|---|---|---|---|---|---|---|---|---|---|---|---|---|---|---|---|---|---|---|---|---|---|---|---|---|---|---|---|---|---|---|---|---|---|---|---|---|---|---|---|---|---|---|---|---|---|---|---|---|---|---|---|---|---|---|---|---|---|---|---|---|---|---|---|---|---|---|---|---|---|---|---|---|---|---|---|---|---|---|---|---|---|---|---|---|---|---|---|---|---|---|---|---|---|---|---|---|---|---|---|---|---|---|---|---|---|---|---|---|---|---|---|---|---|---|---|---|---|---|---|---|---|---|---|---|---|---|---|---|---|---|---|---|---|---|---|---|---|---|---|---|---|---|---|---|---|---|---|---|---|---|---|---|---|---|---|---|---|---|---|---|---|---|---|---|---|---|---|---|---|---|---|---|---|---|---|---|---|---|---|---|---|---|---|---|---|---|---|---|---|---|---|---|---|---|---|---|---|---|---|---|---|---|---|---|---|---|---|---|---|---|---|---|---|---|---|---|---|---|---|---|---|---|---|---|---|---|---|---|---|---|---|---|---|---|---|---|---|---|---|---|---|---|---|---|---|---|---|---|---|---|---|---|---|---|---|---|---|---|---|---|---|---|---|---|---|---|---|---|---|---|---|---|---|---|---|---|---|---|---|---|---|---|---|---|---|---|---|---|---|---|---|---|---|---|---|---|---|---|---|---|---|---|---|---|---|---|---|---|---|---|---|---|---|---|---|---|---|---|---|---|---|---|---|---|---|---|---|---|---|---|---|---|---|---|---|---|---|---|---|---|---|---|---|---|---|---|---|---|---|---|---|---|---|---|---|---|---|---|---|---|---|---|---|---|---|---|---|---|---|---|---|---|---|---|---|---|---|---|---|---|---|---|---|---|---|---|---|---|---|---|---|---|---|---|---|---|---|---|---|---|---|---|---|---|---|---|---|---|---|---|---|---|---|---|---|---|---|---|---|---|---|---|---|---|---|---|---|---|---|---|---|---|---|---|---|---|---|---|---|---|---|---|---|---|---|---|---|---|---|---|---|---|---|---|---|---|---|---|---|---|---|---|---|---|---|---|---|---|---|---|---|---|---|---|---|---|---|---|---|---|---|---|---|---|---|---|---|---|---|---|---|---|---|---|---|---|---|---|---|---|---|---|---|---|---|---|---|---|---|---|---|---|---|---|---|---|---|---|---|---|---|---|---|---|---|---|---|---|---|---|---|---|---|---|---|---|---|---|---|---|---|---|---|---|---|---|---|---|---|---|---|---|---|---|---|---|---|---|---|---|---|---|---|---|---|---|---|---|---|---|---|---|---|---|---|---|---|---|---|---|---|---|---|---|---|---|---|---|
| NAV | Daily Change | Fact Sheet | Holdings | ||||||||||||||||||||||||||||||||||||||||||||||||||||||||||||||||||||||||||||||||||||||||||||||||||||||||||||||||||||||||||||||||||||||||||||||||||||||||||||||||||||||||||||||||||||||||||||||||||||||||||||||||||||||||||||||||||||||||||||||||||||||||||||||||||||||||||||||||||||||||||||||||||||||||||||||||||||||||||||||||||||||||||||||||||||||||||||||||||||||||||||||||||||||||||||||||||||||||||||||||||||||||||||||||||||||||||||||||||||||||||||||||||||||||||||||||||||||||||||||||||||||||||||||||||||||||||||||||||||||||||||||||||||||||||||||||||||||||||||||||||||||||||||||||||||||||||||||||||||||||||||||||||||||||||||||||||||||||||||||||||||||||||||||||||||||||||||||||||||||||||||||||||||||||||||||||||||||||||||||||||||||||||
|
|
|
|
||||||||||||||||||||||||||||||||||||||||||||||||||||||||||||||||||||||||||||||||||||||||||||||||||||||||||||||||||||||||||||||||||||||||||||||||||||||||||||||||||||||||||||||||||||||||||||||||||||||||||||||||||||||||||||||||||||||||||||||||||||||||||||||||||||||||||||||||||||||||||||||||||||||||||||||||||||||||||||||||||||||||||||||||||||||||||||||||||||||||||||||||||||||||||||||||||||||||||||||||||||||||||||||||||||||||||||||||||||||||||||||||||||||||||||||||||||||||||||||||||||||||||||||||||||||||||||||||||||||||||||||||||||||||||||||||||||||||||||||||||||||||||||||||||||||||||||||||||||||||||||||||||||||||||||||||||||||||||||||||||||||||||||||||||||||||||||||||||||||||||||||||||||||||||||||||||||||||||||||||||||||||||
- Multi-factor smart beta ETF
- Power Factor™ approach focuses on generating the highest dividend yield with a deep value bias and multi-factor fundamental analysis to confirm quality
- Designed to track the Solactive Power Factor™ High Dividend Index
|
Prices
|
As of: 07/27/2018 | ||||
|---|---|---|---|---|---|
| Shares Outstanding | Fund Size ($M) | Closing Bid/Ask (Midpoint) | Daily Volume | Premium/Discount | Expense Ratio | |||||
|---|---|---|---|---|---|---|---|---|---|---|
|
|
|
|
|
0.70% |
|
Performance Month End
|
As of: 06/30/2018 | |||||
|---|---|---|---|---|---|---|
| Name | MTD | QTD | YTD | 1 Year | 3 Year | Since Inception 12/19/2016 | ||||||
|---|---|---|---|---|---|---|---|---|---|---|---|---|
| NAV |
|
|
|
|
|
|||||||
| Market |
|
|
|
|
|
|
Performance Quarter End
|
As of: 06/30/2018 | |||||
|---|---|---|---|---|---|---|
| Name | MTD | QTD | YTD | 1 Year | 3 Year | Since Inception 12/19/2016 | ||||||
|---|---|---|---|---|---|---|---|---|---|---|---|---|
| NAV |
|
|
|
|
|
|||||||
| Market |
|
|
|
|
|
Returns are average annualized total returns, except those for periods of less than one year, which are cumulative. The performance data quoted represents past performance and is not a guarantee of future results. Investment return and principal value of an investment will fluctuate so that an investor's shares, when redeemed, may be worth more or less than their original cost. For most recent month-end performance, please see the monthly performance tab.
|
Fund Characteristics
|
As of: 6/30/2018 | |
|---|---|---|
| 30-Day SEC Yield | 30-Day Unsubsidized SEC Yield | ||
|---|---|---|---|
|
|
|
WBIY Top Holdings
|
As of: 07/30/2018 | |
|---|---|---|
| Security Name | Weightings | Shares | ||||||||||||||||||||||||||||||
|---|---|---|---|---|---|---|---|---|---|---|---|---|---|---|---|---|---|---|---|---|---|---|---|---|---|---|---|---|---|---|---|---|
|
|
|
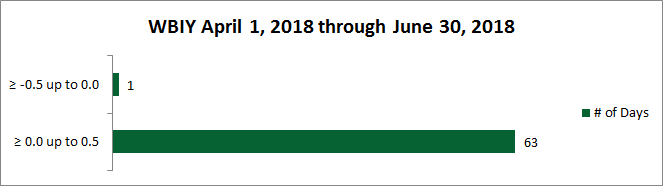
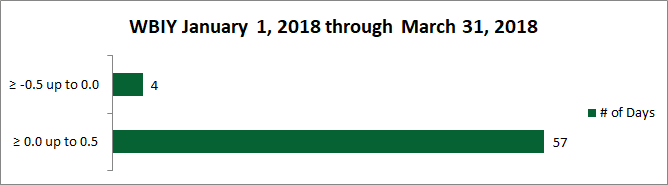
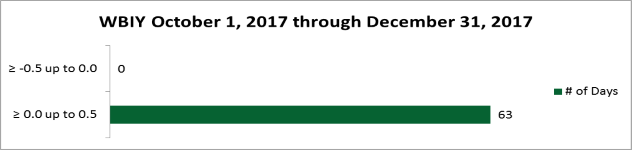
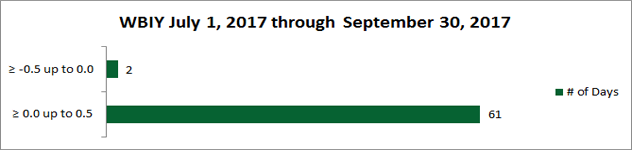
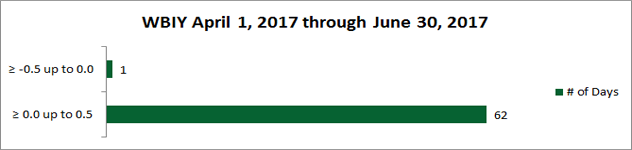

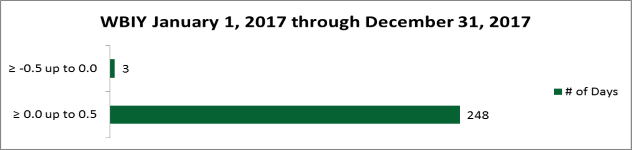
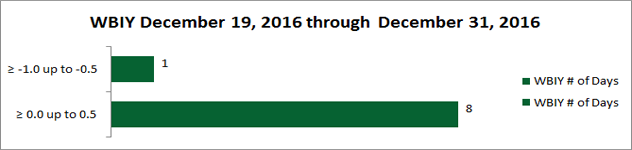
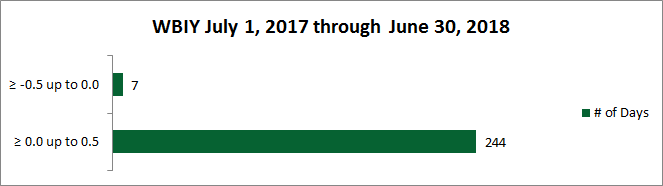
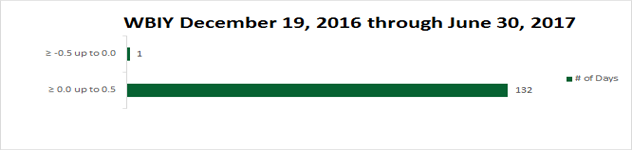
The chart above shows the difference between the daily price for shares of the Fund and the Fund’s NAV (net asset value). The daily price is determined using the midpoint between the highest bid and the lowest offer on the listing exchange, as of 4:00 p.m. EST (when NAV is normally determined for most ETFs). The premium or discount is presented on the vertical axis of the chart and is shown as a percentage of NAV. The number of trading days in the period covered by the chart is indicated on the horizontal axis. The bars in the chart display the number of trading days in which the Fund traded within the premium/discount range shown. The horizontal bar for the range of ≥0.0 up to 0.5 includes the days that the Fund’s daily price matched its NAV (i.e. there was no premium or discount).